 CloudConsole
CloudWatch alarm: EventBridge Scheduler InvocationThrottleCount
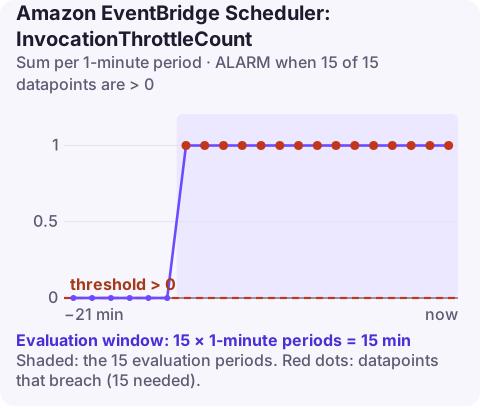
Alarm on AWS/Scheduler InvocationThrottleCount at account level, Sum per 60 seconds, above 0 for 15 of 15 minutes. It fires when EventBridge Scheduler itself is holding back invocations because your account has hit its invocation rate quota, which delays scheduled work across every schedule in the Region.
What this metric means
EventBridge Scheduler has a per-account, per-Region quota on how fast it will invoke targets. When the schedules due at a given moment exceed that rate, Scheduler throttles its own invocations and counts each one here. Nothing is wrong with your targets; the bottleneck is the account's Scheduler quota.
Throttled invocations are delayed, not discarded straight away, so the first symptom is lateness. The problem is usually created by alignment: thousands of schedules on round minutes (on the hour, midnight UTC, the first of the month) all become due in the same second. A quota sized for your average rate is nowhere near enough for that spike.
Compare with TargetErrorThrottledCount, which counts throttling returned by the target service.
Recommended alarm settings
| Setting | Recommended value |
|---|---|
| Namespace | AWS/Scheduler |
| Metric | InvocationThrottleCount |
| Dimensions | None (account level) |
| Statistic | Sum |
| Threshold | 0.0 |
| Period | 60 seconds |
| Datapoints to alarm | 15 |
| Evaluation periods | 15 |
| Comparison operator | GreaterThanThreshold |
Tuning
The published window requires a full 15 minutes of throttling. That suits large fleets where a minute or two of throttling at the top of the hour clears by itself. If you run few schedules, any throttling at all is unusual, and you can drop to 1 of 1. If spikes are predictable (midnight batch), compare the Sum during the spike with the quota for "invocations throttle limit" in Service Quotas to decide whether to spread the load or request more.
A useful companion graph is InvocationAttemptCount at one-minute resolution across a week. If the peak minute is many times the average, the problem is alignment, and spreading schedules is cheaper and faster than a quota increase. If the curve is flat but high, you have simply outgrown the quota.
Create the alarm
aws cloudwatch put-metric-alarm \
  --alarm-name scheduler-invocation-throttled \
  --alarm-description "EventBridge Scheduler throttling its own invocations for 15 minutes" \
  --namespace AWS/Scheduler \
  --metric-name InvocationThrottleCount \
  --statistic Sum \
  --period 60 \
  --evaluation-periods 15 \
  --datapoints-to-alarm 15 \
  --threshold 0 \
  --comparison-operator GreaterThanThreshold \
  --treat-missing-data notBreaching \
  --alarm-actions arn:aws:sns:eu-west-2:123456789012:oncall-alerts
When it fires
- Find the spike. Graph
InvocationAttemptCountalongside this metric at one-minute resolution; the peak usually lines up with a round time. - De-align schedules. Use flexible time windows so invocations are spread across a window you choose, or stagger cron minutes when you create schedules (hash the customer ID into a minute offset).
- Request a higher quota through Service Quotas if the steady demand really exceeds the current invocation limit.
- Check for drops. Prolonged throttling can push invocations past their maximum event age; watch InvocationDroppedCount and your DLQ.
Questions
Is a CloudWatch alarm the same as an EventBridge rule?
No. An alarm watches a metric and changes state; EventBridge routes events. They work together: every alarm state change is also published as an event to the default event bus, which you can route to other targets.
How do I send CloudWatch alarm notifications to EventBridge?
You do not need to configure anything on the alarm: CloudWatch publishes alarm state changes to the default event bus automatically. Create an EventBridge rule that matches them.
Is the Scheduler invocation quota adjustable?
The invocation throttle limit is listed in Service Quotas for EventBridge Scheduler. Check the current value and whether it is adjustable for your Region there.
Scheduler throttling tends to bite at round hours, often midnight UTC, when nobody is watching. CloudConsole is a phone app for AWS, built to let you see which alarm fired and how long it has been in ALARM before you get to a desk.
Did it start after a deploy? What changed? on the app’s alarm screen lists the deploys and configuration changes from the hour before the alarm fired.
About the app → · Download on the App Store