 CloudConsole
aws cloudwatch describe-alarms
aws cloudwatch describe-alarms --state-value ALARM --query "MetricAlarms[].[AlarmName,StateReason]" --output table shows every metric alarm currently firing in the region. Filter by name with --alarm-name-prefix, add --alarm-types CompositeAlarm MetricAlarm to include composite alarms, and use --action-prefix to find alarms that notify a given SNS topic.
What the command does
The response has two lists: MetricAlarms[] and CompositeAlarms[]. Metric alarm entries include AlarmName, StateValue (OK, ALARM or INSUFFICIENT_DATA), StateReason, StateUpdatedTimestamp, ActionsEnabled, the alarm and OK actions, and the full definition: namespace, metric, dimensions, statistic, period, evaluation periods, threshold and comparison operator.
If you do not pass --alarm-types, only metric alarms are returned, even when composite alarms exist.
Syntax
aws cloudwatch describe-alarms \
  [--alarm-names a b | --alarm-name-prefix prod-] \
  [--state-value OK|ALARM|INSUFFICIENT_DATA] \
  [--alarm-types MetricAlarm CompositeAlarm] \
  [--action-prefix arn:aws:sns:eu-west-2:123456789012:oncall]
Worked examples
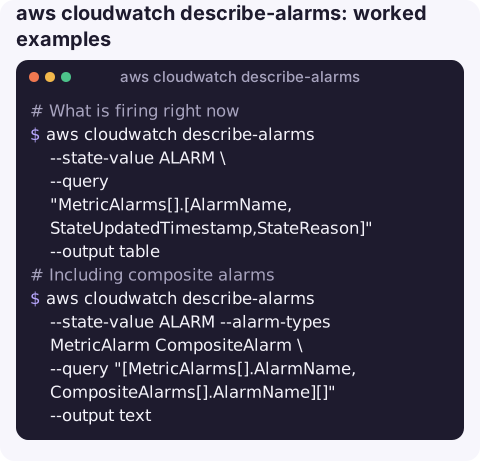
What is firing right now:
aws cloudwatch describe-alarms --state-value ALARM \
  --query "MetricAlarms[].[AlarmName,StateUpdatedTimestamp,StateReason]" --output table
Including composite alarms:
aws cloudwatch describe-alarms --state-value ALARM --alarm-types MetricAlarm CompositeAlarm \
  --query "[MetricAlarms[].AlarmName, CompositeAlarms[].AlarmName][]" --output text
Alarms with notifications switched off, often forgotten after maintenance:
aws cloudwatch describe-alarms \
  --query "MetricAlarms[?ActionsEnabled==\`false\`].AlarmName" --output text
Alarms that would page a particular SNS topic:
aws cloudwatch describe-alarms --action-prefix arn:aws:sns:eu-west-2:123456789012:oncall \
  --query "MetricAlarms[].AlarmName" --output text
Alarms with no actions at all, which alert nobody:
aws cloudwatch describe-alarms \
  --query "MetricAlarms[?length(AlarmActions)==\`0\`].AlarmName" --output text
The full definition of one alarm, ready to recreate or compare:
aws cloudwatch describe-alarms --alarm-names prod-api-5xx \
  --query "MetricAlarms[0].{ns:Namespace,metric:MetricName,dims:Dimensions,stat:Statistic,period:Period,eval:EvaluationPeriods,dta:DatapointsToAlarm,thr:Threshold,op:ComparisonOperator,missing:TreatMissingData}"
Which alarms watch this resource?
During an incident you often start from a resource rather than an alarm name. describe-alarms-for-metric answers "what alarms exist on this metric?", given the same namespace, metric name and dimensions the alarm uses:
aws cloudwatch describe-alarms-for-metric \
  --namespace AWS/EC2 --metric-name CPUUtilization \
  --dimensions Name=InstanceId,Value=i-0123456789abcdef0 \
  --query "MetricAlarms[].[AlarmName,StateValue,Threshold]" --output table
For a broader sweep, search the alarm definitions themselves, for example every alarm that mentions a given Lambda function in its dimensions:
aws cloudwatch describe-alarms \
  --query "MetricAlarms[?Dimensions[?Value=='checkout']].[AlarmName,MetricName,StateValue]" --output table
Alarms built with metric math keep their metrics under Metrics[] rather than the top-level fields, so they do not show up in either query; look for them by name prefix instead.
Reading alarm state
| State | Means |
|---|---|
OK | The metric is within the threshold. |
ALARM | Enough datapoints breached; StateReason lists the values that did. |
INSUFFICIENT_DATA | Not enough data to evaluate: new alarm, metric stopped reporting, or dimensions that match no metric at all. |
An alarm stuck in INSUFFICIENT_DATA forever usually has a typo in a dimension name or value. Compare with aws cloudwatch list-metrics.
Gotchas
- Per region. Alarms live in the region of their metric; billing alarms live in
us-east-1. - Text output and pagination. Accounts with many alarms span several pages; projections work fine, but use JSON output if you sort or count.
- Prefix filters are case-sensitive and only match the start of the name, so a consistent naming scheme (
prod-service-signal) pays off. - History is separate. This shows the current state only; use
describe-alarm-historyto see when it changed.
Questions
How do I list all CloudWatch alarms with the CLI?
aws cloudwatch describe-alarms --query "MetricAlarms[].[AlarmName,StateValue]" --output table, plus --alarm-types CompositeAlarm if you use composite alarms.
How do I list only alarms in ALARM state?
Pass --state-value ALARM to describe-alarms.
How do I see the history of an alarm?
Use aws cloudwatch describe-alarm-history --alarm-name <name> --history-item-type StateUpdate.
The list of alarms currently firing is the first screen most people want when paged. CloudConsole, a phone app for AWS, is built to show exactly that on a phone, with the metric and logs behind each alarm.
About the app → · Download on the App Store