 CloudConsole
CloudWatch alarm: Kinesis ReadProvisionedThroughputExceeded
Alarm on AWS/Kinesis ReadProvisionedThroughputExceeded per StreamName with the Average over 60 seconds, firing when it stays above your threshold for 5 of 5 minutes. The Average is the share of GetRecords calls that were throttled, so a threshold like 0.05 means more than 5% of reads were rejected for exceeding shard read limits.
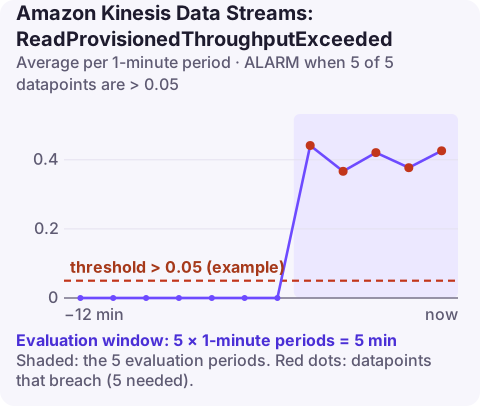
What the metric tells you
Every GetRecords call that Kinesis rejects because the shard's read limits were exceeded counts here. Limits apply per shard: five calls per second and 2 MB per second, shared by all consumers that do not use enhanced fan-out. With the Average statistic, you get the fraction of calls throttled, which is easier to alarm on than a raw count that grows with traffic.
Throttled reads are retried, so occasional throttling is harmless. Persistent throttling slows consumers and shows up next as rising iterator age.
Usual causes, most common first: several applications polling the same stream, consumers polling too often with no backoff on empty responses, one hot shard taking most of the traffic, and a consumer catching up after downtime and reading at full speed.
Recommended alarm settings
| Setting | Recommended value |
|---|---|
| Namespace | AWS/Kinesis |
| Metric | ReadProvisionedThroughputExceeded |
| Dimensions | StreamName |
| Statistic | Average |
| Threshold | Depends on your situation (a fraction of calls; see below) |
| Period | 60 seconds |
| Datapoints to alarm | 5 |
| Evaluation periods | 5 |
| Comparison operator | GreaterThanThreshold |
Choosing a threshold
A threshold of zero pages you for routine retries, so start from what your consumers can absorb:
- Chart the Average for two weeks. Many healthy streams sit between 0 and 0.01.
- Set the threshold above normal peaks, often 0.05 to 0.1.
- Watch iterator age at the same time. If iterator age stays flat while throttling is at 0.1, consumers are coping and the threshold can go higher; if age climbs at 0.03, go lower.
If the stream feeds a Lambda function through an event source mapping, the function's polling counts against the same shared limits as any other consumer, so adding a second Lambda trigger on the stream doubles the polling pressure.
Create the alarm
aws cloudwatch put-metric-alarm \
  --alarm-name kinesis-orders-read-throttled \
  --alarm-description "More than 5% of GetRecords calls on orders throttled" \
  --namespace AWS/Kinesis \
  --metric-name ReadProvisionedThroughputExceeded \
  --dimensions Name=StreamName,Value=orders \
  --statistic Average \
  --period 60 \
  --evaluation-periods 5 \
  --datapoints-to-alarm 5 \
  --threshold 0.05 \
  --comparison-operator GreaterThanThreshold \
  --alarm-actions arn:aws:sns:eu-west-2:123456789012:oncall-alerts
When it fires
- Count consumers on shared throughput. If more than one or two applications read the stream, register the heavy ones as enhanced fan-out consumers; each gets its own read throughput per shard.
- Find a hot shard by enabling shard-level metrics:
If one shard dominates, split it, or fix the partition key that concentrates traffic.aws kinesis enable-enhanced-monitoring \ --stream-name orders \ --shard-level-metrics ReadProvisionedThroughputExceeded OutgoingBytes - Add shards if all shards are evenly busy:
aws kinesis update-shard-count \ --stream-name orders \ --target-shard-count 8 \ --scaling-type UNIFORM_SCALING - Tune consumers: fewer, larger
GetRecordscalls and a short sleep when a call returns no records.
Questions
Why is my stream throttling reads when it is not busy?
Read limits are per shard and shared across shared-throughput consumers. Three consumers polling five times a second each will exceed the five-calls-per-second shard limit even with little data.
Does enhanced fan-out remove read throttling?
It gives each registered consumer its own dedicated read throughput per shard, delivered via SubscribeToShard, which removes contention between consumers. It is billed separately.
Read throttling is usually a slow-burn problem, so it helps to see the trend before deciding whether to wake anyone. CloudConsole, a phone app for AWS, is built to show the alarm with its history on your phone.
Did it start after a deploy? What changed? on the app’s alarm screen lists the deploys and configuration changes from the hour before the alarm fired.
About the app → · Download on the App Store