 CloudConsole
CloudWatch alarm: Kinesis GetRecords.IteratorAgeMilliseconds
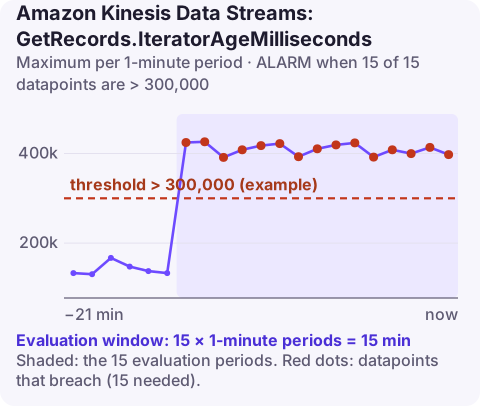
Alarm on AWS/Kinesis GetRecords.IteratorAgeMilliseconds per StreamName using the Maximum over 60 seconds, firing when it stays above your threshold for 15 of 15 minutes. Set the threshold to the smaller of your processing-delay tolerance and half the stream's retention period, because records that age past retention are deleted before your consumer reads them.
What iterator age measures
Each GetRecords call returns records plus how far behind the tip of the shard they are. GetRecords.IteratorAgeMilliseconds is the age of the last record returned, in milliseconds. Zero means consumers are reading data as it arrives; a growing number means they are falling behind. With the Maximum statistic and only StreamName, the alarm follows the slowest shard-consumer pair on the stream.
The risk is concrete: Kinesis deletes records once they are older than the retention period (24 hours by default, configurable up to 365 days). If iterator age reaches retention, the consumer skips data it never processed.
The pattern on a graph tells you a lot. A sawtooth that resets means the consumer catches up between bursts. A straight upward line means it has stopped, usually stuck retrying one bad record. A slow climb over days means processing capacity has not kept pace with traffic.
Recommended alarm settings
| Setting | Recommended value |
|---|---|
| Namespace | AWS/Kinesis |
| Metric | GetRecords.IteratorAgeMilliseconds |
| Dimensions | StreamName |
| Statistic | Maximum |
| Threshold | Depends on your situation (pick using the method below) |
| Period | 60 seconds |
| Datapoints to alarm | 15 |
| Evaluation periods | 15 |
| Comparison operator | GreaterThanThreshold |
How to choose the threshold
- Start from retention. Read it with
aws kinesis describe-stream-summary --stream-name clickstream --query "StreamDescriptionSummary.RetentionPeriodHours". Half of that is your hard upper limit: for 24 hours that is 43,200,000 ms. - Apply your business tolerance. A real-time fraud or alerting pipeline may tolerate only a few minutes (300,000 ms); a nightly analytics loader may tolerate hours.
- Check history. Chart the Maximum for two weeks and note normal peaks during deploys and traffic bursts. Set the threshold well above those and below the two limits above.
- Use the smallest of the three.
The 15-minute window ignores consumer restarts and rebalances, which commonly cause a brief jump.
Create the alarm
aws cloudwatch put-metric-alarm \
  --alarm-name kinesis-clickstream-iterator-age \
  --alarm-description "clickstream consumers more than 5 minutes behind for 15 minutes" \
  --namespace AWS/Kinesis \
  --metric-name GetRecords.IteratorAgeMilliseconds \
  --dimensions Name=StreamName,Value=clickstream \
  --statistic Maximum \
  --period 60 \
  --evaluation-periods 15 \
  --datapoints-to-alarm 15 \
  --threshold 300000 \
  --comparison-operator GreaterThanThreshold \
  --alarm-actions arn:aws:sns:eu-west-2:123456789012:oncall-alerts
300,000 ms is an example for a near-real-time pipeline. If a Lambda function consumes the stream, the equivalent per-function metric is IteratorAge in AWS/Lambda.
When it fires
- Buy time first: if age is approaching retention, raise retention so nothing expires while you fix the consumer (this has a cost):
aws kinesis increase-stream-retention-period \ --stream-name clickstream \ --retention-period-hours 72 - Is the consumer stuck? A Lambda consumer retries a failing batch until it succeeds or the records expire, blocking that shard. Check the function's errors; set a maximum retry count, bisect-on-error and an on-failure destination with update-event-source-mapping.
- Is it slow? Look for slow downstream calls in the processing path, and for read throttling.
- Add parallelism: more shards, more KCL workers, or a higher parallelisation factor for Lambda.
Questions
What is a good IteratorAgeMilliseconds threshold?
There is no universal value. Use the smaller of your acceptable processing delay and 50% of the stream's retention period, checked against two weeks of history.
Why does iterator age keep rising when there are no errors?
Usually the consumer is too slow for the incoming rate: a slow downstream call per record, too few workers, or read throttling. A flat line followed by a steep climb usually means one shard is stuck on a bad record.
Does increasing retention fix iterator age?
No, it only prevents data loss while you fix the consumer. The age keeps growing until processing catches up.
A consumer that falls behind overnight can lose data before anyone is awake to see it. CloudConsole, a phone app for AWS, is built to show the alarm with the lag trend so you can tell a stuck shard from a slow one on your phone.
Did it start after a deploy? What changed? on the app’s alarm screen lists the deploys and configuration changes from the hour before the alarm fired.
About the app → · Download on the App Store