 CloudConsole
CloudWatch alarm: Kinesis PutRecord.Success
Alarm on AWS/Kinesis PutRecord.Success per StreamName, Average over 60 seconds, firing when the success ratio stays below your threshold for 5 consecutive minutes. Falling success almost always means producers are hitting a shard's write limit, and records that are not retried successfully never reach the stream.
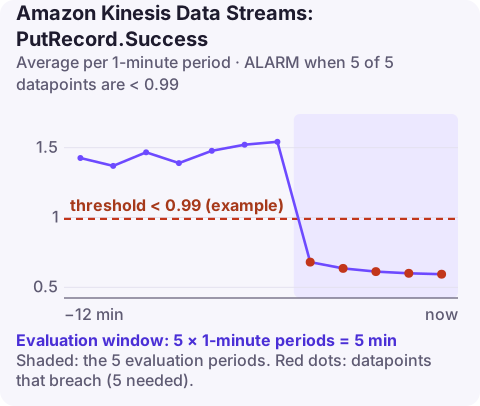
What the metric covers
PutRecord.Success counts single-record writes: 1 for each PutRecord call that succeeded, 0 for each that failed, so the Average is a success ratio. It does not cover the batch API; writes made with PutRecords are measured by PutRecords.FailedRecords and related metrics.
Each shard accepts up to 1,000 records or 1 MB per second of writes. Exceed either on any shard and the call fails with ProvisionedThroughputExceededException. Because limits are per shard, a stream with plenty of total capacity can still reject writes if partition keys send most traffic to one shard.
On-demand streams change the picture slightly: there is no shard count to manage, but writes can still fail if traffic jumps far above what the stream has recently handled, so the alarm stays useful after switching capacity mode.
Recommended alarm settings
| Setting | Recommended value |
|---|---|
| Namespace | AWS/Kinesis |
| Metric | PutRecord.Success |
| Dimensions | StreamName |
| Statistic | Average |
| Threshold | Depends on your situation (success ratio between 0 and 1) |
| Period | 60 seconds |
| Datapoints to alarm | 5 |
| Evaluation periods | 5 |
| Comparison operator | LessThanThreshold |
Picking the threshold
- Measure your normal floor. Chart one-minute Averages for two weeks. Many producers sit at exactly 1.0; others see a trickle of throttles at peak.
- Account for retries. If producers retry with backoff, a 0.98 success ratio may still mean no data loss. If they do not, even 0.999 can mean lost events, and the threshold should be very close to 1.
- Consider criticality. Audit or billing events justify a tight threshold; sampled telemetry can tolerate more.
A common starting point is 0.99, then adjust.
Remember that the Average only covers minutes in which producers made PutRecord calls; a producer that stops entirely produces no datapoints rather than a low ratio.
Create the alarm
aws cloudwatch put-metric-alarm \
  --alarm-name kinesis-events-putrecord-success \
  --alarm-description "Fewer than 99% of PutRecord calls on events succeeding" \
  --namespace AWS/Kinesis \
  --metric-name PutRecord.Success \
  --dimensions Name=StreamName,Value=events \
  --statistic Average \
  --period 60 \
  --evaluation-periods 5 \
  --datapoints-to-alarm 5 \
  --threshold 0.99 \
  --comparison-operator LessThanThreshold \
  --alarm-actions arn:aws:sns:eu-west-2:123456789012:oncall-alerts
When it fires
- Confirm throttling: check WriteProvisionedThroughputExceeded for the same period.
- Look for a hot shard. Enable shard-level metrics and compare
IncomingRecordsper shard:
Enhanced monitoring is billed per shard-level metric, so turn it off when done.aws kinesis enable-enhanced-monitoring \ --stream-name events \ --shard-level-metrics IncomingRecords IncomingBytes WriteProvisionedThroughputExceeded - Fix the partition key if one key dominates (a tenant ID with one huge tenant, a constant value, a date).
- Add capacity: increase shards with
aws kinesis update-shard-count, or switch the stream to on-demand capacity mode. - Batch: producers sending one record per call should move to
PutRecordsor the KPL, which aggregates records.
Questions
Does PutRecord.Success include PutRecords batch calls?
No. It only reflects the single-record PutRecord API. Use the PutRecords.* metrics for batch writes.
Are failed PutRecord calls retried automatically?
AWS SDKs retry throttled calls a limited number of times with backoff. If all retries fail, the error reaches your code and the record is lost unless you handle it.
Producer failures matter most when nobody is watching the dashboards, because lost events cannot be read back later. CloudConsole, a phone app for AWS, is built to show this kind of alarm on your phone with the related metrics alongside.
Did it start after a deploy? What changed? on the app’s alarm screen lists the deploys and configuration changes from the hour before the alarm fired.
About the app → · Download on the App Store