 CloudConsole
CloudWatch alarm: Kinesis WriteProvisionedThroughputExceeded
Alarm on AWS/Kinesis WriteProvisionedThroughputExceeded per StreamName with the Average over 60 seconds, firing when it exceeds your threshold for 5 consecutive minutes. The Average is the fraction of records rejected for exceeding shard write limits; sustained values mean producers are being turned away and must retry or lose data.
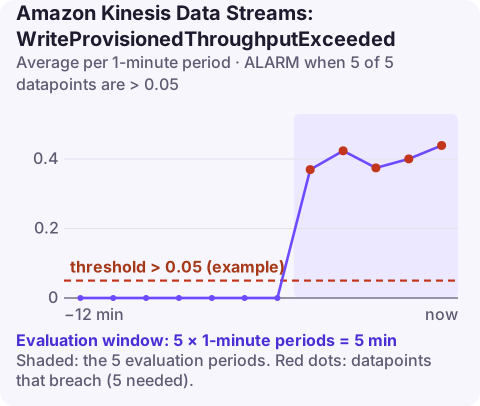
What the metric measures
Kinesis limits writes per shard to 1,000 records or 1 MB per second. Records over the limit are rejected with ProvisionedThroughputExceededException and counted here. The Average gives you a throttled fraction, comparable across quiet and busy periods.
Throttling is not always a shortage of total capacity. Look at how traffic is distributed:
| Pattern | Likely cause |
|---|---|
Throttling while stream-wide IncomingBytes is well under total capacity | Hot shard from a skewed partition key |
| Throttling only in short bursts | Producers flushing large batches at the same instant |
| Throttling at every daily peak | Not enough shards for peak load |
In on-demand capacity mode Kinesis scales shards for you, but it can still throttle when traffic jumps far above recent peaks faster than scaling can follow.
Recommended alarm settings
| Setting | Recommended value |
|---|---|
| Namespace | AWS/Kinesis |
| Metric | WriteProvisionedThroughputExceeded |
| Dimensions | StreamName |
| Statistic | Average |
| Threshold | Depends on your situation (a fraction of records; see below) |
| Period | 60 seconds |
| Datapoints to alarm | 5 |
| Evaluation periods | 5 |
| Comparison operator | GreaterThanThreshold |
Choosing the threshold
Zero is too sensitive, because SDKs and the KPL retry throttled writes. Decide based on how your producers behave:
- Producers that retry with backoff and can buffer: 0.05 to 0.1 is a reasonable start.
- Producers that cannot buffer (for example, a Lambda function that gives up after its own timeout): go lower, around 0.01.
- Validate with two weeks of history and check that the alarm would have fired during any incident where data went missing.
Graph this metric next to IncomingBytes and IncomingRecords with the Sum statistic. If throttling starts while stream-wide incoming volume is far below the shard count multiplied by per-shard limits, raising the shard count will help less than fixing the key distribution.
Create the alarm
aws cloudwatch put-metric-alarm \
  --alarm-name kinesis-events-write-throttled \
  --alarm-description "More than 5% of writes to events throttled for 5 minutes" \
  --namespace AWS/Kinesis \
  --metric-name WriteProvisionedThroughputExceeded \
  --dimensions Name=StreamName,Value=events \
  --statistic Average \
  --period 60 \
  --evaluation-periods 5 \
  --datapoints-to-alarm 5 \
  --threshold 0.05 \
  --comparison-operator GreaterThanThreshold \
  --alarm-actions arn:aws:sns:eu-west-2:123456789012:oncall-alerts
When it fires
- Check for a hot shard with shard-level metrics (
aws kinesis enable-enhanced-monitoringwithIncomingBytesandWriteProvisionedThroughputExceeded), then compare shards. - Fix partition keys if one shard is overloaded. Random or high-cardinality keys spread records evenly; keep a natural key only where you need ordering for it.
- Add shards with
aws kinesis update-shard-count, or move to on-demand mode if load is unpredictable. Resharding takes time, so it is not an instant fix. - Smooth producers: jitter batch flush times and use KPL aggregation to pack small records together.
- Check for loss: compare with PutRecords.FailedRecords and producer error logs.
Questions
Does on-demand mode prevent write throttling?
It removes manual shard management and scales automatically, but sudden spikes well above recent traffic can still be throttled while it scales.
What is a hot shard?
A shard receiving a disproportionate share of writes because many records share the same partition key or keys that hash close together. It throttles even though the stream as a whole has spare capacity.
Write throttling during a traffic peak needs a quick decision about adding capacity, often away from a laptop. CloudConsole, a phone app for AWS, is built to show the alarm and stream metrics on your phone.
Did it start after a deploy? What changed? on the app’s alarm screen lists the deploys and configuration changes from the hour before the alarm fired.
About the app → · Download on the App Store