 CloudConsole
CloudWatch alarm: S3 Object Lambda 4xxErrors
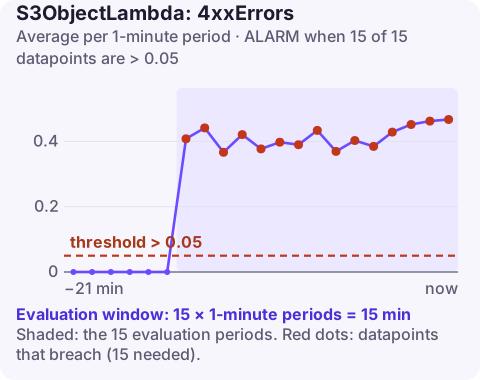
Alarm on AWS/S3ObjectLambda 4xxErrors for the AccessPointName and DataSourceARN, Average over 60 seconds, firing when it is above 0.05 for 15 of 15 minutes. It tells you more than 5% of requests to an Object Lambda Access Point are getting client errors, whether from permissions, missing objects, or a status code your function chose to return.
What is different about Object Lambda errors
With S3 Object Lambda, a GetObject (or other supported call) goes to an Object Lambda Access Point, which invokes your Lambda function; the function fetches the original object, transforms it and returns the result with WriteGetObjectResponse. A 4xx reaching the client can come from three places:
- Authorisation before the function runs: the caller lacks permission on the Object Lambda Access Point, the supporting access point, or to invoke the function.
- Your function's own decision: it passed a 4xx status code to
WriteGetObjectResponse, for example a 404 when the source object is missing or a 403 from your own access rules. - The source fetch: the presigned URL the function receives returns an error, and the function passes it through.
The metric is published per access point and data source. Its Average is an error ratio, like the S3 bucket request metrics.
Recommended alarm settings
| Setting | Recommended value |
|---|---|
| Namespace | AWS/S3ObjectLambda |
| Metric | 4xxErrors |
| Dimensions | AccessPointName, DataSourceARN |
| Statistic | Average |
| Threshold | 0.05 |
| Period | 60 seconds |
| Datapoints to alarm | 15 |
| Evaluation periods | 15 |
| Comparison operator | GreaterThanThreshold |
Make sure CloudWatch request metrics are enabled on the Object Lambda Access Point, or the metric will not be published.
Tuning
If the function intentionally returns 404 or 403 for business reasons (hiding objects from some callers), your normal 4xx rate may be well above 5%. Base the threshold on two weeks of history, and consider having the function log which branch produced the code, so a spike can be attributed quickly.
Each Object Lambda Access Point has its own metrics. If you run one access point per transformation (redaction, resizing, format conversion), create an alarm per access point rather than assuming a problem in one will show in another.
Create the alarm
aws cloudwatch put-metric-alarm \
  --alarm-name s3ol-redacted-docs-4xx-rate \
  --alarm-description "More than 5% of requests to redacted-docs returning 4xx" \
  --namespace AWS/S3ObjectLambda \
  --metric-name 4xxErrors \
  --dimensions Name=AccessPointName,Value=redacted-docs Name=DataSourceARN,Value=arn:aws:s3:eu-west-2:123456789012:accesspoint/docs-ap \
  --statistic Average \
  --period 60 \
  --evaluation-periods 15 \
  --datapoints-to-alarm 15 \
  --threshold 0.05 \
  --comparison-operator GreaterThanThreshold \
  --treat-missing-data notBreaching \
  --alarm-actions arn:aws:sns:eu-west-2:123456789012:oncall-alerts
When it fires
- Check the function's logs in CloudWatch Logs: if it ran and chose a 4xx, the reason should be there.
- If the function did not run, look at CloudTrail and server access logs for authorisation failures on the access points.
- Check recent changes to the access point policies, the caller's IAM policy, and the function's permissions.
- Compare with LambdaResponse4xx, which isolates errors from the function's own
WriteGetObjectResponsecalls.
Questions
How do I create a CloudWatch alarm for an S3 bucket?
Enable request metrics on the bucket with a metrics configuration (a filter), then alarm on metrics such as 4xxErrors or 5xxErrors using the BucketName and FilterId dimensions. Daily storage metrics like BucketSizeBytes need no setup but are only updated once a day.
Where do I see S3 Object Lambda metrics?
In the AWS/S3ObjectLambda namespace, per Object Lambda Access Point and data source, once request metrics are enabled on the access point.
Object Lambda errors can come from the caller, the function or the source bucket, so having the alarm and logs close together helps. CloudConsole, a phone app for AWS, is built to show both on your phone.
Did it start after a deploy? What changed? on the app’s alarm screen lists the deploys and configuration changes from the hour before the alarm fired.
About the app → · Download on the App Store