 CloudConsole
CloudWatch alarm: Amazon S3 4xxErrors
Alarm on AWS/S3 4xxErrors for the BucketName and FilterId of a request metrics configuration, using the Average over 60 seconds, firing when it is above 0.05 for 15 of 15 minutes. Each request counts as 1 if it returned a 4xx and 0 if not, so an Average of 0.05 means more than 5% of requests to the bucket are failing with client errors.
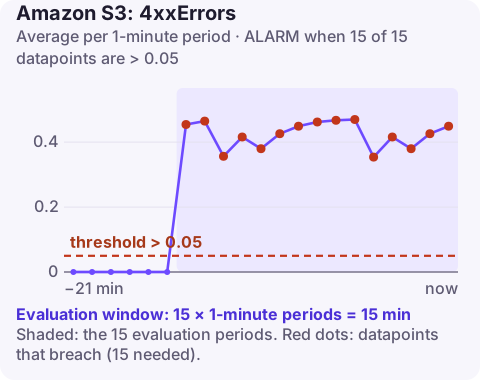
What the metric measures
4xxErrors is one of S3's request metrics. For every request in the filter's scope, S3 records 1 if the response was a 4xx status and 0 otherwise. Sum gives you a count; Average gives you an error rate, which is what this alarm uses so the threshold works at any traffic level.
Which 4xx codes typically dominate:
| Status | Common real-world cause |
|---|---|
| 403 AccessDenied | IAM or bucket policy change, missing KMS permission, expired presigned URLs, Block Public Access |
| 404 NoSuchKey | Clients requesting objects that do not exist, often existence checks or a broken key prefix after a deploy |
| 400 | Malformed requests, wrong region signing, bad headers |
| 412 / 416 | Conditional request preconditions not met, invalid byte ranges |
Recommended alarm settings
| Setting | Recommended value |
|---|---|
| Namespace | AWS/S3 |
| Metric | 4xxErrors |
| Dimensions | BucketName, FilterId |
| Statistic | Average |
| Threshold | 0.05 |
| Period | 60 seconds |
| Datapoints to alarm | 15 |
| Evaluation periods | 15 |
| Comparison operator | GreaterThanThreshold |
Request metrics are not on by default. They are billed as custom CloudWatch metrics and need a metrics configuration on the bucket; the configuration's ID becomes the FilterId dimension:
aws s3api put-bucket-metrics-configuration \
  --bucket my-bucket \
  --id EntireBucket \
  --metrics-configuration Id=EntireBucket
Tuning the threshold
Some applications have a high normal 404 rate by design: a cache layer that checks S3 before generating content, or clients probing for optional files. Chart the Average over two weeks; if normal is 8%, a 5% threshold will never be quiet. Set it above the normal rate, or narrow the metrics configuration with a prefix filter to the paths where 4xx really means something is broken.
Low-traffic buckets are the opposite problem: two failed requests out of ten is 20%. The 15-of-15 window helps, but you may prefer a Sum-based alarm for them.
Create the alarm
aws cloudwatch put-metric-alarm \
  --alarm-name s3-my-bucket-4xx-rate \
  --alarm-description "More than 5% of requests to my-bucket returning 4xx for 15 minutes" \
  --namespace AWS/S3 \
  --metric-name 4xxErrors \
  --dimensions Name=BucketName,Value=my-bucket Name=FilterId,Value=EntireBucket \
  --statistic Average \
  --period 60 \
  --evaluation-periods 15 \
  --datapoints-to-alarm 15 \
  --threshold 0.05 \
  --comparison-operator GreaterThanThreshold \
  --treat-missing-data notBreaching \
  --alarm-actions arn:aws:sns:eu-west-2:123456789012:oncall-alerts
When it fires
- Split by code: S3 server access logs (enable temporarily if not on) record HTTP status and error code per request; CloudTrail data events give the caller identity for 403s.
- 403 spike: check recent bucket policy, IAM and KMS key policy changes; see S3 AccessDenied and KMS AccessDenied.
- 404 spike: look at which keys are requested; a deploy that changed a key prefix, or a cleanup job that deleted objects still referenced, are common. See NoSuchKey.
- Presigned URL failures: expiry or clock skew, see Request has expired.
Questions
How do I create a CloudWatch alarm for an S3 bucket?
Enable request metrics on the bucket with a metrics configuration (a filter), then alarm on metrics such as 4xxErrors or 5xxErrors using the BucketName and FilterId dimensions. Daily storage metrics like BucketSizeBytes need no setup but are only updated once a day.
How do I see why S3 requests return 403?
Server access logs show the error code for each request, and CloudTrail data events show who made it. Compare the caller's permissions with the bucket policy, IAM policy and any KMS key policy.
A sudden wave of S3 access errors often follows a policy change, so the time the alarm started is the most useful clue. CloudConsole, a phone app for AWS, is built to show alarm history on your phone so you can match it to recent changes.
Did it start after a deploy? What changed? on the app’s alarm screen lists the deploys and configuration changes from the hour before the alarm fired.
About the app → · Download on the App Store