 CloudConsole
CloudWatch alarm: Lambda Errors
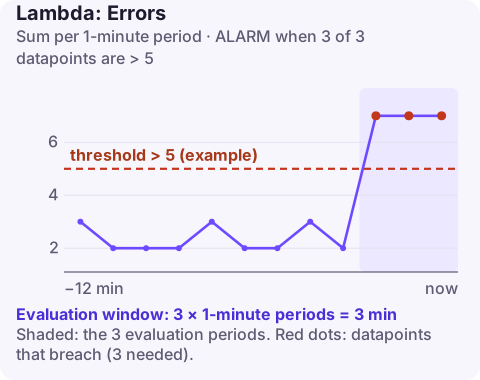
Alarm on AWS/Lambda Errors per FunctionName using the Sum over 60 seconds, firing when it is above your threshold for 3 consecutive minutes. Choose a threshold above zero that reflects how many failed invocations the function can tolerate; for low-traffic critical functions that may be 0, for high-volume ones an error rate via metric math works better.
What Lambda counts as an error
Errors counts invocations that ended in a function error: an exception your handler threw or did not catch, a timeout, running out of memory, or the runtime crashing. Throttled requests are not included; they appear in Throttles.
Two details trip people up. First, for asynchronous invocations (S3, SNS, EventBridge) Lambda retries failures, so one bad event can count up to three times. Second, a handler that catches an exception and returns a normal response is a success as far as this metric is concerned, even if the caller sees an error body. API Gateway 5xx responses built by your own code will not show up here.
Recommended alarm settings
| Setting | Recommended value |
|---|---|
| Namespace | AWS/Lambda |
| Metric | Errors |
| Dimensions | FunctionName |
| Statistic | Sum |
| Threshold | Depends on your situation (choose a value above zero) |
| Period | 60 seconds |
| Datapoints to alarm | 3 |
| Evaluation periods | 3 |
| Comparison operator | GreaterThanThreshold |
Choosing a threshold
- Critical, low-volume functions (payments, provisioning): use 0, so any error for three minutes running pages someone.
- Steady, high-volume functions: look at a week of one-minute Sums and set the threshold above the normal background, for example the 99th percentile of minute values plus a margin.
- Variable traffic: a fixed count is too sensitive at peak and blind at night. Use metric math,
100 * Errors / Invocations, and alarm on a percentage such as 2%.
Three of three minutes filters single transient failures, such as one downstream timeout, while still reacting fast.
For functions behind API Gateway that catch exceptions and return error responses, this alarm will stay quiet during an incident. Either let unexpected exceptions propagate, or pair this alarm with one on the API's 5xx metric.
Create the alarm
aws cloudwatch put-metric-alarm \
  --alarm-name lambda-checkout-errors \
  --alarm-description "checkout-handler more than 5 errors a minute for 3 minutes" \
  --namespace AWS/Lambda \
  --metric-name Errors \
  --dimensions Name=FunctionName,Value=checkout-handler \
  --statistic Sum \
  --period 60 \
  --evaluation-periods 3 \
  --datapoints-to-alarm 3 \
  --threshold 5 \
  --comparison-operator GreaterThanThreshold \
  --treat-missing-data notBreaching \
  --alarm-actions arn:aws:sns:eu-west-2:123456789012:oncall-alerts
No invocations means no errors, so notBreaching is the right missing-data choice.
When it fires
- Read the logs. Use a Logs Insights error count to see when errors started and which messages dominate.
- Classify:
Task timed outlines point to timeouts;Runtime.ExitErroror a killed signal to memory; a stack trace to code or a dependency. - Correlate with deploys. If errors began right after a new version, roll back the alias first and investigate after.
- Protect events: for async sources, make sure a dead-letter queue or on-failure destination is set, so events that keep failing are kept.
Questions
How do I alarm on Lambda timeouts specifically?
Timeouts are included in Errors. For a dedicated signal, use a metric filter on the log group matching "Task timed out" or alarm on Duration approaching the configured timeout.
Can a CloudWatch alarm trigger a Lambda function?
Yes. Configure the function as the alarm action directly or subscribe it to the SNS topic the alarm notifies, for example to post to chat.
Why does Errors show more failures than requests I sent?
Asynchronous invocations are retried on error, and each attempt is counted separately.
Lambda error alarms are the ones most likely to buzz while you are out. CloudConsole, a phone app for AWS, is built to show the alarm with the recent error log lines on the same screen.
Did it start after a deploy? What changed? on the app’s alarm screen lists the deploys and configuration changes from the hour before the alarm fired.
About the app → · Download on the App Store