 CloudConsole
CloudWatch alarm: SQS NumberOfMessagesSent (producer stopped)
Alarm on AWS/SQS NumberOfMessagesSent per QueueName with the Sum over 60 seconds, firing when it is less than or equal to 0 for 15 of 15 minutes. It tells you a producer that should be sending continuously has gone quiet for a quarter of an hour; for low-traffic queues, lengthen the evaluation window so normal gaps do not trigger it.
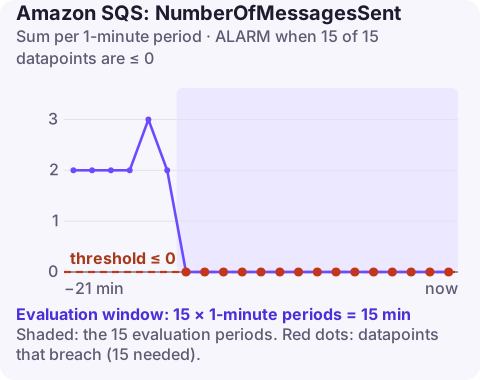
What the metric counts
NumberOfMessagesSent counts messages added to the queue by SendMessage and SendMessageBatch. Alarming on zero turns it into a heartbeat for the producer: if the upstream service crashes, loses permission to send, points at the wrong queue after a config change, or simply has no work, the count drops to nothing.
One important exception: messages moved into a queue by a redrive policy (because they failed processing elsewhere) are not counted in the dead-letter queue's NumberOfMessagesSent. So this metric cannot tell you that a DLQ is receiving messages; use ApproximateNumberOfMessagesVisible on the DLQ for that.
The alarm is the queue-side view of producer health. It catches the cases where a producer's own monitoring is silent too, for example when the whole producer service is down and emits nothing at all, and it works without any change to the producer's code.
Recommended alarm settings
| Setting | Recommended value |
|---|---|
| Namespace | AWS/SQS |
| Metric | NumberOfMessagesSent |
| Dimensions | QueueName |
| Statistic | Sum |
| Threshold | 0.0 |
| Period | 60 seconds |
| Datapoints to alarm | 15 |
| Evaluation periods | 15 |
| Comparison operator | LessThanOrEqualToThreshold |
Getting the window and missing data right
- Traffic level: 15 one-minute periods suits queues that receive messages every minute. If your producer sends a few messages an hour, use a longer period (for example 3,600 seconds) or more evaluation periods, as AWS suggests for low-throughput queues.
- Missing data: SQS stops publishing metrics for queues that are inactive for several hours. A producer that has stopped completely can therefore produce missing data rather than zeros. Set
--treat-missing-data breachingso silence counts. - Expected quiet periods: if the producer is a business-hours system, nights will look like an outage. Either accept that and route the alarm accordingly, or suppress it outside hours.
Pick the window from the producer's real rhythm: look at the longest normal gap between sends over two weeks and make the evaluation window clearly longer than that gap.
Create the alarm
aws cloudwatch put-metric-alarm \
  --alarm-name sqs-orders-producer-silent \
  --alarm-description "No messages sent to orders for 15 minutes" \
  --namespace AWS/SQS \
  --metric-name NumberOfMessagesSent \
  --dimensions Name=QueueName,Value=orders \
  --statistic Sum \
  --period 60 \
  --evaluation-periods 15 \
  --datapoints-to-alarm 15 \
  --threshold 0 \
  --comparison-operator LessThanOrEqualToThreshold \
  --treat-missing-data breaching \
  --alarm-actions arn:aws:sns:eu-west-2:123456789012:oncall-alerts
When it fires
- Check the producer: is it running, and are its logs showing send errors? Access denied on
sqs:SendMessageor KMS errors on an encrypted queue are common after policy changes; see KMS access denied. - Check the queue URL in its configuration; a renamed or recreated queue produces NonExistentQueue errors.
- Check upstream demand: perhaps there is genuinely no work (no orders, a paused scheduled job).
- Test a send with send-message using the producer's role to separate permission problems from application ones.
Questions
How do I set a CloudWatch alarm on an SQS dead-letter queue?
Alarm on ApproximateNumberOfMessagesVisible for the DLQ with GreaterThanThreshold 0, so any message landing there notifies you. Do not use NumberOfMessagesSent on a DLQ, because messages moved there by a redrive policy are not counted in it.
How do I know if an SQS producer has stopped sending?
Alarm on NumberOfMessagesSent with LessThanOrEqualToThreshold 0 over a window that matches the producer's normal rate, and treat missing data as breaching.
A silent producer does not throw errors anywhere you would normally look, which is exactly why this alarm exists. CloudConsole, a phone app for AWS, is built to surface alarms like this on your phone alongside the queue's other metrics.
Did it start after a deploy? What changed? on the app’s alarm screen lists the deploys and configuration changes from the hour before the alarm fired.
About the app → · Download on the App Store