 CloudConsole
aws ce get-cost-and-usage
aws ce get-cost-and-usage returns your AWS spend from Cost Explorer for a date range, at DAILY, MONTHLY or HOURLY granularity, optionally grouped by service, account, tag or other dimensions. The end date is exclusive, and each call to the Cost Explorer API is billed per request.
What the command does
It queries the same data as the Cost Explorer console. You choose a time period, a granularity, one or more metrics (UnblendedCost is what most people mean by "cost"), and optionally up to two --group-by keys and a --filter. Results come back per time bucket under ResultsByTime.
Cost Explorer has to be enabled in the account, and the caller needs ce:GetCostAndUsage. In an organization, the management account sees all member accounts; a member account sees only its own costs unless granted otherwise.
Syntax
aws ce get-cost-and-usage \
  --time-period Start=YYYY-MM-DD,End=YYYY-MM-DD \
  --granularity DAILY|MONTHLY|HOURLY \
  --metrics UnblendedCost [AmortizedCost ...] \
  [--group-by Type=DIMENSION,Key=SERVICE] \
  [--filter file://filter.json]
Worked examples
Month to date, total:
aws ce get-cost-and-usage \
  --time-period Start=2026-11-01,End=2026-11-16 \
  --granularity MONTHLY --metrics UnblendedCost \
  --query "ResultsByTime[0].Total.UnblendedCost.[Amount,Unit]" --output text
This month by service, biggest first:
aws ce get-cost-and-usage \
  --time-period Start=2026-11-01,End=2026-11-16 \
  --granularity MONTHLY --metrics UnblendedCost \
  --group-by Type=DIMENSION,Key=SERVICE \
  --query "reverse(sort_by(ResultsByTime[0].Groups, &to_number(Metrics.UnblendedCost.Amount)))[:10].[Keys[0], Metrics.UnblendedCost.Amount]" \
  --output table
Daily spend for the last week, to spot the day something changed:
aws ce get-cost-and-usage \
  --time-period Start=2026-11-09,End=2026-11-16 \
  --granularity DAILY --metrics UnblendedCost \
  --query "ResultsByTime[].[TimePeriod.Start, Total.UnblendedCost.Amount]" --output text
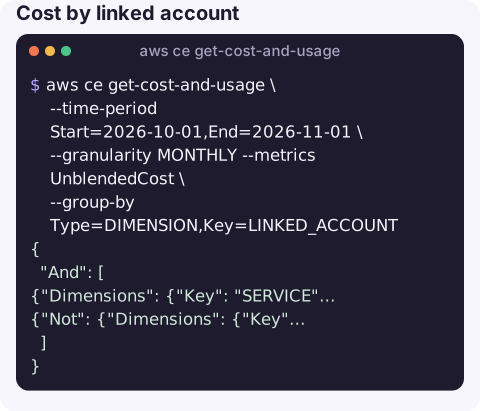
Cost by linked account (management account):
aws ce get-cost-and-usage \
  --time-period Start=2026-10-01,End=2026-11-01 \
  --granularity MONTHLY --metrics UnblendedCost \
  --group-by Type=DIMENSION,Key=LINKED_ACCOUNT
One service, excluding credits and refunds. filter.json:
{
  "And": [
    {"Dimensions": {"Key": "SERVICE", "Values": ["Amazon Relational Database Service"]}},
    {"Not": {"Dimensions": {"Key": "RECORD_TYPE", "Values": ["Credit", "Refund"]}}}
  ]
}
aws ce get-cost-and-usage \
--time-period Start=2026-11-01,End=2026-11-16 \
--granularity DAILY --metrics UnblendedCost \
--filter file://filter.jsonBy cost allocation tag (the tag must be activated in Billing first):
aws ce get-cost-and-usage \
  --time-period Start=2026-11-01,End=2026-11-16 \
  --granularity MONTHLY --metrics UnblendedCost \
  --group-by Type=TAG,Key=team
Metrics
| Metric | Use it for |
|---|---|
UnblendedCost | What each usage line was charged. The default choice. |
AmortizedCost | Spreads upfront Savings Plan and Reserved Instance fees across the period they cover. |
NetUnblendedCost / NetAmortizedCost | After discounts such as private pricing. |
BlendedCost | Organisation-wide averaged rates; rarely what you want. |
UsageQuantity | Usage amounts, only meaningful when filtered to one usage type, since units differ. |
Gotchas
- End is exclusive.
End=2026-11-16stops at the end of 15 November. To include today, use tomorrow's date. - Grouped results have an empty Total. When you use
--group-by, the numbers are inGroups; sum them yourself if you need a total. - Recent data is estimated. Cost data is refreshed periodically (at least daily) and the current period is marked
"Estimated": true. - Every request costs money. The Cost Explorer API charges per request, including each paginated page. Do not poll it every minute from a dashboard.
- HOURLY needs opting in to hourly granularity in Cost Explorer settings, and covers only a recent window.
- Service names are long-form: "Amazon Elastic Compute Cloud - Compute", not "EC2". Get exact values with
aws ce get-dimension-values --dimension SERVICE.
Questions
How do I see my AWS bill from the command line?
Use get-cost-and-usage with MONTHLY granularity and UnblendedCost for the current month, grouped by SERVICE. For the invoice itself, use the Billing console; Cost Explorer shows cost data, not the invoice document.
Why is Total empty in my get-cost-and-usage output?
Because you used --group-by. Totals are then reported per group under Groups, and you need to add them up.
How far back can Cost Explorer go?
By default about 13 months of history are available. Cost Explorer settings let you turn on a longer, multi-year history if you need older data.
Cost spikes rarely announce themselves until the bill arrives. CloudConsole, a phone app for AWS, is built to show costs alongside alarms and resources on your phone, so a jump in daily spend is visible sooner.
About the app → · Download on the App Store