 CloudConsole
How to see an AWS cost breakdown
Open Cost Explorer in the Billing and Cost Management console, set the date range, and use Group by to split costs by Service, then by Usage type, Region, linked account or a cost allocation tag. The CLI equivalent is aws ce get-cost-and-usage with --group-by. For line-item detail per resource, export the cost and usage data to S3 and query it.
Pick the right grouping
Each grouping answers a different question. Work from the top down:
| Group by | Answers |
|---|---|
| Service | Which product is costing money? |
| Usage type | What exactly inside that service: instance hours, GB stored, data transfer, NAT gateway processing? |
| Region | Is something running where you don't expect? |
| Linked account | Which account in the organisation? (management account view) |
| Tag | Which team, project or environment? Only works for tags activated as cost allocation tags. |
| API operation | Which request type, for example S3 PUTs versus GETs. |
A common surprise is the EC2 - Other service line. It is not instances: it collects EBS volumes and snapshots, NAT gateway charges, data transfer and idle Elastic IPs. Grouping it by usage type shows which.
In the console
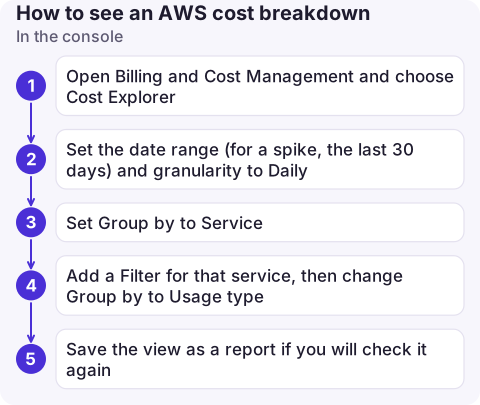
- Open Billing and Cost Management and choose Cost Explorer.
- Set the date range (for a spike, the last 30 days) and granularity to Daily.
- Set Group by to Service. Find the bar that jumped.
- Add a Filter for that service, then change Group by to Usage type. The usage type names include a Region prefix, such as
EUW2-for eu-west-2. - Save the view as a report if you will check it again.
With the CLI
# Daily cost by service for the first half of November
aws ce get-cost-and-usage --region us-east-1 \
  --time-period Start=2026-11-01,End=2026-11-16 \
  --granularity DAILY --metrics UnblendedCost \
  --group-by Type=DIMENSION,Key=SERVICE \
  --output json > by-service.json

# Inside "EC2 - Other", which usage types?
aws ce get-cost-and-usage --region us-east-1 \
  --time-period Start=2026-11-01,End=2026-11-16 \
  --granularity MONTHLY --metrics UnblendedCost \
  --filter '{"Dimensions":{"Key":"SERVICE","Values":["EC2 - Other"]}}' \
  --group-by Type=DIMENSION,Key=USAGE_TYPE \
  --query 'ResultsByTime[0].Groups[].[Keys[0],Metrics.UnblendedCost.Amount]' --output text | sort -k2 -gr

# By a cost allocation tag
aws ce get-cost-and-usage --region us-east-1 \
  --time-period Start=2026-10-01,End=2026-11-01 \
  --granularity MONTHLY --metrics UnblendedCost \
  --group-by Type=TAG,Key=project
You can group by at most two keys at once. Each Cost Explorer API request carries a small charge.
Going down to individual resources
- Resource-level data in Cost Explorer is an opt-in setting in Cost Explorer preferences. Once on, you can group some services' daily costs by resource ID for recent days (via
get-cost-and-usage-with-resourceson the CLI). It is off by default. - Data exports (the Cost and Usage Report) deliver hourly or daily line items, including resource IDs, to an S3 bucket. Query them with Athena when you need full detail or history.
Things that trip people up
- Untagged or newly tagged resources. Cost allocation tags only apply from when you activate them, and only to resources that carry them. Expect a large "No tag" group.
- Unblended vs amortised. With Savings Plans or Reserved Instances, unblended cost shows upfront fees on the purchase day; amortised spreads them. Use amortised for trends.
- Credits and refunds appear as negative amounts and can hide real usage. Filter out the Credit charge type to see underlying spend.
- Data lag. The most recent day is usually incomplete.
Questions
How do I see AWS costs per resource?
Turn on resource-level data in Cost Explorer settings for recent daily data, or set up a data export of the Cost and Usage Report to S3 and query the resource ID column with Athena.
What is "EC2 - Other" in my AWS bill?
It is EC2-related charges that are not instance hours: EBS volumes and snapshots, NAT gateways, data transfer and public IPv4 addresses. Group it by usage type to see which.
Why doesn't my tag show up in Cost Explorer?
User-defined tags must be activated as cost allocation tags in the billing console, and data only appears from activation onwards.

Knowing which service moved is usually enough to decide whether a cost spike can wait until morning. CloudConsole, a phone app for AWS, is built to show costs by service on your phone.
About the app → · Download on the App Store