 CloudConsole
CloudWatch usage types decoded
DataProcessing-Bytes is the CloudWatch usage type for log data ingested into Standard-class log groups, and it is usually the biggest CloudWatch line. Other common ones are TimedStorage-ByteHrs (log storage), DataScanned-Bytes (Logs Insights queries), MetricMonitorUsage (custom and detailed-monitoring metrics), GMD-Metrics (GetMetricData calls) and AlarmMonitorUsage (alarms). Each carries a Region prefix, such as USE1- or EU-.
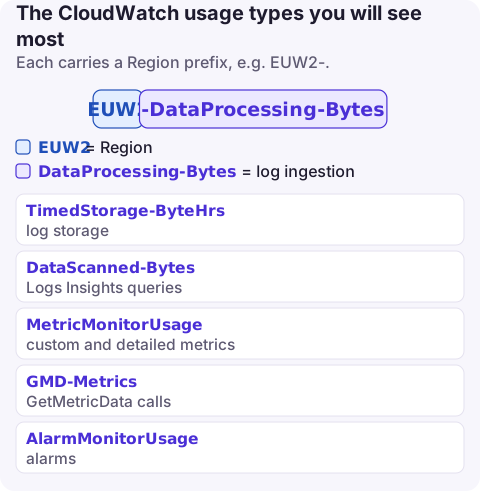
How the names are built
AWS documents the format as <Region>-CW:<Feature> or <Region>-<Feature>. So EU-CW:GMD-Metrics is GetMetricData requests in eu-west-1, and USE1-DataProcessing-Bytes is log ingestion in us-east-1. Some free tier usage is tracked under a Global- prefix. Note that the Logs lines reuse names other services also use (TimedStorage-ByteHrs also exists in S3), so filter by Service = CloudWatch first.
The usage types you are most likely to see
| Usage type | Feature | What drives it |
|---|---|---|
DataProcessing-Bytes | Logs ingestion, Standard class | GB written by applications |
DataProcessingIA-Bytes | Logs ingestion, Essentials (Infrequent Access) class | GB written |
VendedLog-Bytes | Vended logs into CloudWatch Logs | VPC flow logs, Route 53 resolver logs and similar |
S3-Egress-Bytes, FH-Egress-Bytes | Vended logs delivered to S3 or Firehose | GB delivered |
TimedStorage-ByteHrs | Log storage | Retention x volume |
DataScanned-Bytes | Logs Insights | GB scanned by queries, including dashboards that run them |
MetricMonitorUsage | Custom metrics, detailed monitoring, EMF and metric-filter metrics | Number of metrics, prorated hourly |
Requests | API calls such as PutMetricData, GetMetricStatistics, ListMetrics | Call volume above the free tier |
GMD-Metrics | GetMetricData | Metrics requested, charged from the first call |
MetricStreamUsage | Metric streams | Metric updates streamed |
AlarmMonitorUsage, HighResAlarmMonitorUsage | Metric alarms | Alarm metrics, prorated hourly |
DashboardsUsageHour | Dashboards | Dashboards over the free allowance |
Less common lines that still surprise people
Logs-LiveTail: Live Tail session minutes above the monthly free allowance; a tab left open on a busy log group keeps the session running.DataProtection-Bytes: log data protection policies scanning and masking sensitive data, billed per GB scanned.ContributorInsightRulesandContributorInsightEvents: Contributor Insights rules and the log events they match.Canary-runs: Synthetics canaries, billed per run, so a one-minute schedule adds up across many canaries.DatabaseInsights-vCPU-Hoursor-ACU-Hours: Database Insights in Advanced mode.ObservationUsageandMetricsUsage: Container Insights with enhanced observability for EKS and ECS.
Break CloudWatch spend down
aws ce get-cost-and-usage --region us-east-1 \
  --time-period Start=2026-11-01,End=2026-11-17 \
  --granularity MONTHLY --metrics UnblendedCost \
  --filter '{"Dimensions":{"Key":"SERVICE","Values":["AmazonCloudWatch"]}}' \
  --group-by Type=DIMENSION,Key=USAGE_TYPE Type=DIMENSION,Key=OPERATION \
  --query 'ResultsByTime[0].Groups[].[Keys[0],Keys[1],Metrics.UnblendedCost.Amount]' \
  --output text | sort -k3 -gr | head -20
The Operation adds detail: PutLogEvents for ingestion, HourlyStorageMetering for storage, StartQuery for Logs Insights, and for metrics MetricStorage:AWS/Logs-EMF (embedded metric format) or MetricStorage:AWS/CloudWatchLogs (metric filters). If the service filter returns nothing, check the exact service name with aws ce get-dimension-values --dimension SERVICE.
Where to go next for each line
DataProcessing-Bytes,TimedStorage-ByteHrs,DataScanned-Bytes: CloudWatch Logs cost.VendedLog-Bytes: usually VPC flow logs; see flow logs cost.MetricMonitorUsage,GMD-Metrics,Requests: custom metrics cost. A third-party monitoring tool polling GetMetricData is a frequent cause.AlarmMonitorUsage,DashboardsUsageHour: alarm and dashboard cost.
A common misreading is blaming metrics for a CloudWatch bill that is really log ingestion. Check DataProcessing-Bytes first; it dominates for most accounts.
Questions
What is DataProcessing-Bytes in CloudWatch?
The usage type for log data ingested into Standard-class CloudWatch Logs log groups, billed per GB.
What is CW:GMD-Metrics?
Charges for GetMetricData API requests, billed by the number of metrics requested; these calls are not covered by the free API request allowance.
What is MetricMonitorUsage?
Custom metrics, detailed monitoring metrics, embedded metric format metrics and metric-filter metrics, each billed per metric per month, prorated by the hour.
CloudWatch has more usage types than most services, and the names are cryptic. CloudConsole, a phone app for AWS, shows spend by usage type and explains each CloudWatch line in plain words, so you can tell logs from metrics from your phone.
About the app → · Download on the App Store