 CloudConsole
CloudWatch custom metrics cost
Each unique combination of namespace, metric name and dimensions is one custom metric, billed per month and prorated by the hour while data is sent. The CloudWatch pricing examples for US East (N. Virginia) use $0.30 per metric per month for the first 10,000 metrics, falling in tiers above that. API calls cost extra: PutMetricData beyond the free tier, and GetMetricData from the first call.
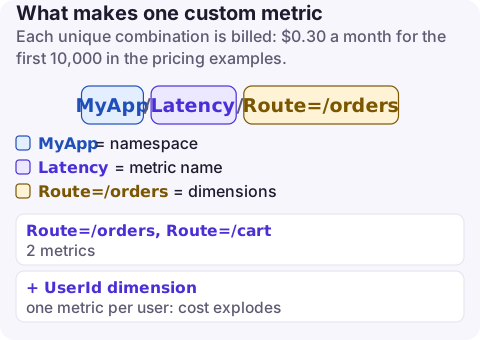
What counts as a metric
- Dimensions multiply metrics. A latency metric with dimensions
Service,EndpointandCustomerIdcreates one metric per combination. Add a high-cardinality dimension like customer or request ID and you can create thousands of metrics from one line of code. - Detailed monitoring on EC2 and other services is billed as custom metrics (
MetricMonitorUsage, OperationMetricStorage:AWS/EC2). - Embedded metric format (EMF) logs create custom metrics as well as log ingestion charges.
- Metric filters on log groups publish custom metrics too (Operation
MetricStorage:AWS/CloudWatchLogs). - API Gateway detailed metrics and similar per-resource options multiply by methods, resources and stages.
A metric that receives no data in an hour is not billed for that hour, so short-lived metrics cost only for the hours they were active.
API calls that cost money
| Call | Usage type | Note |
|---|---|---|
| PutMetricData | Requests | Within the free tier allowance of 1 million requests, then per 1,000. Batch values to cut calls. |
| GetMetricStatistics, ListMetrics | Requests | Same free allowance |
| GetMetricData | GMD-Metrics | Charged per metric requested, from the first call |
| Metric streams | MetricStreamUsage | Per 1,000 metric updates |
Third-party monitoring tools that poll GetMetricData every minute across hundreds of metrics are a common source of GMD-Metrics cost. Metric streams can be cheaper for continuous export. Metrics Insights queries run from the console are free; the same queries run through the API are charged per metric analysed.
Find the expensive namespaces
# Metric count per custom namespace (each line = one billable metric if it receives data)
aws cloudwatch list-metrics --namespace MyApp --recently-active PT3H \
  --query 'length(Metrics)'

# Top dimension names in a namespace, to spot high-cardinality ones
aws cloudwatch list-metrics --namespace MyApp --recently-active PT3H \
  --query 'Metrics[].Dimensions[].Name' --output text | tr '\t' '\n' | sort | uniq -c | sort -rn

# EC2 instances with detailed monitoring on
aws ec2 describe-instances \
  --filters Name=monitoring-state,Values=enabled \
  --query 'Reservations[].Instances[].InstanceId' --output text
In Cost Explorer, filter Service = CloudWatch, group by Operation: MetricStorage:<namespace> lines show which namespace or source is costing most.
Reduce it
- Remove high-cardinality dimensions. Keep per-customer or per-request detail in logs and query it with Logs Insights.
- Turn off detailed monitoring where 5-minute basic metrics are enough:
aws ec2 unmonitor-instances --instance-ids i-0123456789abcdef0. - Batch PutMetricData with many values per call, or publish through EMF.
- Cut GetMetricData polling in third-party tools: fewer metrics, longer intervals, or metric streams.
- Delete unused metric filters on log groups nobody alarms on.
What not to do: delete metrics an alarm depends on. Check aws cloudwatch describe-alarms-for-metric before removing a source.
Questions
How much does a CloudWatch custom metric cost?
The pricing page examples for US East (N. Virginia) use $0.30 per metric per month for the first 10,000 metrics, with lower tiers above that, prorated hourly.
Why do I have so many custom metrics?
Each unique dimension combination is a separate metric. A dimension with many values, such as a user or request ID, multiplies the count.
Is GetMetricData free?
No. GetMetricData is charged per metric requested and is excluded from the free API request allowance.
A single deploy that adds a high-cardinality dimension can multiply metric costs overnight. CloudConsole, a phone app for AWS, shows CloudWatch spend by usage type with MetricMonitorUsage explained, so the jump is visible from your phone.
About the app → · Download on the App Store