 CloudConsole
Filter CloudWatch logs by request ID
Search the log group for the request ID as a substring: filter @message like "<request-id>" | sort @timestamp asc. That returns every line the request produced, including Lambda's START, END and REPORT lines, in order. Select several log groups to follow the request through API Gateway and Lambda together.
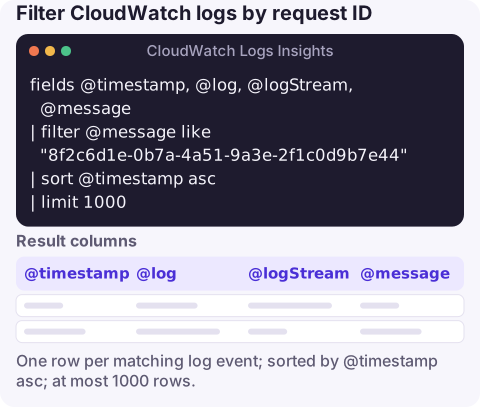
The query
fields @timestamp, @log, @logStream, @message
| filter @message like "8f2c6d1e-0b7a-4a51-9a3e-2f1c0d9b7e44"
| sort @timestamp asc
| limit 1000
Choose the function's log group, plus any other groups the request may have touched, and a time range that safely covers it (a request ID alone doesn't tell Logs Insights where to look in time).
How it works
fieldsincludes@logand@logStreamso you can see which group and which execution environment each line came from.filter @message like "…"is a plain substring match on the whole raw event. It catches the ID wherever it appears: in Lambda platform lines, in the prefix Lambda's default text format adds to each application line, and inside JSON payloads.sort @timestamp ascputs lines in the order they happened, so the story reads top to bottom.limit 1000leaves room for chatty requests.
Why not filter @requestId = "…"? @requestId is only populated on lines where Logs Insights can identify it, mainly Lambda's own platform lines and standard-format application lines. The substring search is more forgiving, especially for custom log formats.
Following a request across services
- API Gateway to Lambda. The API Gateway request ID and the Lambda request ID are different values. For REST APIs, execution logs (log group
API-Gateway-Execution-Logs_<api-id>/<stage>) prefix each line with the API Gateway request ID in brackets, and the integration response headers in those logs normally include the Lambda request ID. Search for the first, read off the second, then search the function's group. Adding the integration's request ID to your access log format saves this step. - X-Ray trace ID. If tracing is on, Lambda REPORT lines carry
@xrayTraceId; one trace ID ties together every service the request passed through. - Your own correlation ID. Generate one at the edge, pass it in a header and log it as a JSON field; then
filter correlationId = "…"works across every service and log group.
The same search from the CLI
Logs Insights is best for multi-group searches. For a quick look in one group, filter-log-events or aws logs tail with a filter pattern also work. The quotes make the ID a single term:
aws logs filter-log-events \
  --log-group-name /aws/lambda/my-function \
  --start-time 1794787200000 \
  --filter-pattern '"8f2c6d1e-0b7a-4a51-9a3e-2f1c0d9b7e44"' \
  --query 'events[].[timestamp,message]' --output text

aws logs tail /aws/lambda/my-function --since 1h \
  --filter-pattern '"8f2c6d1e-0b7a-4a51-9a3e-2f1c0d9b7e44"'
Filter patterns are a different syntax from Logs Insights: they're also what metric filters and subscription filters use, so "ERROR" or { $.level = "ERROR" } work in all three. Logs Insights expressions such as like /regex/ don't.
Limits and cost
A request-ID search scans everything in the selected groups and time range, even though it returns a handful of lines. Narrow the range to a few minutes around the request (the API Gateway access log or the client's error message usually gives you the time) and select only the relevant groups. This is the classic case where a tight time range turns an expensive query into a cheap one.
Questions
How do I search CloudWatch logs for a request ID?
In Logs Insights, run filter @message like "<request-id>" | sort @timestamp asc on the relevant log groups. From the CLI, use aws logs filter-log-events with --filter-pattern set to the quoted ID.
Why does filter @requestId return nothing?
@requestId is only set on lines Logs Insights recognises, such as Lambda platform lines. Use a substring match on @message instead.
Is the API Gateway request ID the same as the Lambda request ID?
No. They're separate IDs. Use API Gateway execution logs or a custom access-log field to map one to the other.
A customer's error message with a request ID often arrives when you're not at your laptop. CloudConsole, a phone app for AWS, is built to let you look up the matching logs from your phone.
About the app → · Download on the App Store