 CloudConsole
API Gateway 5xx errors with Logs Insights
With JSON access logging enabled, query the stage's access log group with filter status >= 500 and group by route and status to see which endpoints are failing and how. For the reason behind each failure, add the integration error message to the access log, or search the REST API execution logs for "Method completed with status: 5".
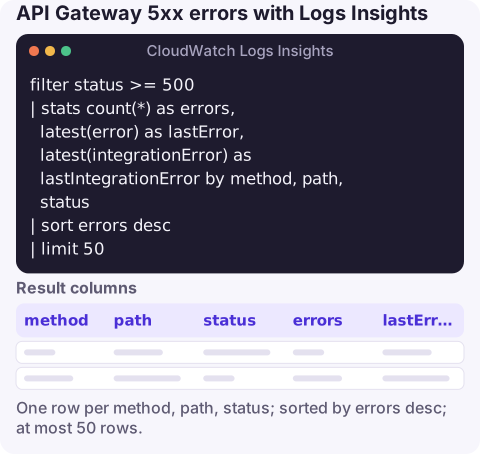
The query
Assuming an access log format along these lines (numbers unquoted so they stay numeric):
{"requestId":"$context.requestId","ip":"$context.identity.sourceIp","method":"$context.httpMethod","path":"$context.resourcePath","status":$context.status,"latency":$context.responseLatency,"integrationStatus":"$context.integrationStatus","error":"$context.error.message","integrationError":"$context.integrationErrorMessage"}this query lists the failing routes:
filter status >= 500
| stats count(*) as errors, latest(error) as lastError, latest(integrationError) as lastIntegrationError by method, path, status
| sort errors desc
| limit 50
How it works
filter status >= 500keeps server-side failures. Because the access log is JSON, Logs Insights discoversstatusas a number.stats … by method, path, statusgives one row per route and status code, so a single broken endpoint stands out from general noise.latest(error)andlatest(integrationError)attach the most recent API Gateway error message and integration error to each row, which usually names the cause directly.sort errors descputs the worst routes first.
For HTTP APIs, use $context.routeKey in the log format instead of resourcePath.
What the 5xx codes usually mean
| Status | Typical cause | Detail |
|---|---|---|
| 500 | API Gateway couldn't run the integration: missing invoke permission, bad mapping template, misconfigured authoriser | Execution log: Execution failed due to configuration error |
| 502 | Integration returned something API Gateway couldn't use, often a Lambda proxy response in the wrong shape, or the function threw | Malformed Lambda proxy response |
| 503 | Backend unavailable | Check the target's health and any network path |
| 504 | Integration didn't respond in time (29 seconds by default for REST APIs) | Endpoint request timed out |
A status in the access log comes from API Gateway; integrationStatus is what the backend returned. A 502 with an integration status of 200 points at the response format, not the backend logic.
Variations
5xx over time, to see when the failures started and whether they correlate with latency:
filter status >= 500
| stats count(*) as errors, avg(latency) as avgLatencyMs by bin(5m)
Run the same query without the filter to get total requests per bucket for comparison.
REST API execution logs, when access logs aren't set up:
filter @message like /Method completed with status: 5/
| parse @message /^\((?<reqId>[^)]+)\) Method completed with status: (?<status>\d+)/
| stats count(*) as n by status
Then search the same group for one reqId to read its full execution trace, including the endpoint response body.
Client-facing errors that aren't 5xx, such as Missing Authentication Token, show up as 403s; see missing authentication token.
Limits and cost
Execution logging at INFO level is very verbose and costs both ingestion and query scanning; switch it on while investigating and back to ERROR or off afterwards. Access logs are the cheaper long-term source. For alerting, use the 5XXError metric (see API Gateway 5XXError alarm) and keep these queries for diagnosis.
Questions
How do I see API Gateway errors in CloudWatch?
Enable access logging (and execution logging for REST APIs) on the stage, then query the log group in Logs Insights with filter status >= 500.
What are the API Gateway error codes?
4xx codes are client errors such as 403 and 429; 5xx are server-side: 500 configuration errors, 502 bad integration responses, 503 unavailable backends and 504 integration timeouts.
What does 'Network error communicating with endpoint' mean?
API Gateway couldn't reach the backend at the network level, for example through a VPC link or to a private endpoint. Check connectivity and target health.
API 5xx alarms are exactly the kind that fire while you're commuting. CloudConsole, a phone app for AWS, is built to show the alarm and the failing routes on your phone.
About the app → · Download on the App Store