 CloudConsole
aws logs tail
aws logs tail /aws/lambda/my-function --follow prints a CloudWatch Logs group's recent events and keeps streaming new ones, like tail -f. Use --since 1h to look further back than the default 10 minutes, and --filter-pattern to show only matching events.
What the command does
aws logs tail is an AWS CLI version 2 convenience command; it does not exist in version 1. It reads events from every stream in a log group (or the streams you name), merges them in time order, prints them, and with --follow keeps polling for new events until you press Ctrl+C. Each line shows the timestamp, the log stream and the message.
Syntax
aws logs tail <log-group-name> \
  [--follow] [--since 10m|1h|2d|<ISO timestamp>] \
  [--filter-pattern <pattern>] \
  [--format detailed|short|json] \
  [--log-stream-names <name> ...] [--log-stream-name-prefix <prefix>]
Worked examples
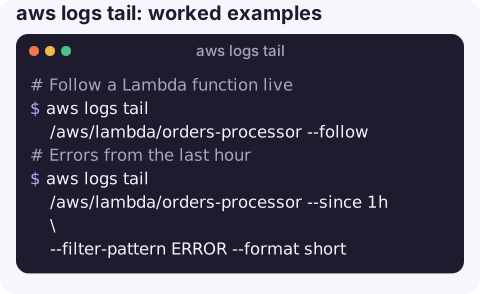
Follow a Lambda function live:
aws logs tail /aws/lambda/orders-processor --followErrors from the last hour, compact output:
aws logs tail /aws/lambda/orders-processor --since 1h \
  --filter-pattern ERROR --format short
Several terms: ? means "any of":
aws logs tail /ecs/orders-api --since 30m --filter-pattern "?ERROR ?Exception ?timeout"Structured JSON logs, matching a field:
aws logs tail /ecs/orders-api --follow \
  --filter-pattern '{ $.level = "error" && $.route = "/checkout" }'
Only one ECS task's streams, by prefix:
aws logs tail /ecs/orders-api --since 15m \
  --log-stream-name-prefix api/orders-api/3f1c2b7d
Find the log group name if you are not sure:
aws logs describe-log-groups --log-group-name-prefix /aws/lambda/orders \
  --query "logGroups[].logGroupName" --output text
Save a window of logs to a file for an incident ticket:
aws logs tail /aws/lambda/orders-processor --since 2026-11-16T09:00:00Z --format short > orders-0900.logDuring an incident
Open two terminals: one following the noisy service with a broad error pattern, and one for targeted look-backs with --since and a narrower pattern such as a request ID. When you find an interesting event, note its timestamp and stream name from the detailed format; that pair is what you need to find the surrounding lines later, either with another --since window and --log-stream-names, or in Logs Insights.
Options
| Option | Notes |
|---|---|
--follow | Keep printing new events. Without it the command prints and exits. |
--since | Start point: relative (30s, 10m, 2h, 1d, 1w) or an absolute timestamp. Default 10m. |
--filter-pattern | CloudWatch Logs filter syntax: terms, ? alternatives, -term exclusions, JSON field matches. |
--format | detailed (default) includes the stream name; short shows only time and message; json is meant for JSON messages. |
--log-stream-names / --log-stream-name-prefix | Limit to particular streams. |
Gotchas
- "Invalid choice: tail" means you are on CLI version 1. Upgrade to version 2.
- Ingestion delay. Events can appear a few seconds after they were written, so a quiet tail is not proof nothing is happening.
- Busy log groups throttle. Tailing a group that ingests heavily can hit API rate limits and fall behind. For high-volume streaming, start-live-tail (the API behind the console's Live Tail) is designed for it.
- Long look-backs are slow.
--since 7don a big group pages through a lot of data; use Logs Insights to search history instead. - Patterns are case-sensitive:
ERRORdoes not matcherror.
Questions
How do I filter aws logs tail output?
Use --filter-pattern with CloudWatch Logs filter syntax, for example ERROR, "?ERROR ?WARN" for either term, or '{ $.level = "error" }' for JSON logs. Piping to grep also works for quick checks.
What is the difference between aws logs tail and start-live-tail?
tail polls the log group with regular API calls and prints results; start-live-tail opens a streaming session that pushes events as they arrive and is better for busy groups. Live Tail usage is billed separately.
How do I tail Lambda logs from the CLI?
aws logs tail /aws/lambda/<function-name> --follow. The log group is created when the function first writes logs.
Watching logs scroll is how most incidents are followed once they start. CloudConsole, a phone app for AWS, is built to bring logs and the alarms that point to them onto a phone screen.
About the app → · Download on the App Store