 CloudConsole
CloudWatch alarm for API Gateway 4XXError (REST API)
Alarm on the REST API metric 4XXError using the Average statistic, which API Gateway reports as the fraction of requests that returned a 4xx. AWS recommends alerting when that fraction is above 0.05 (5%) in 5 out of 5 one-minute periods for an ApiName and Stage pair.
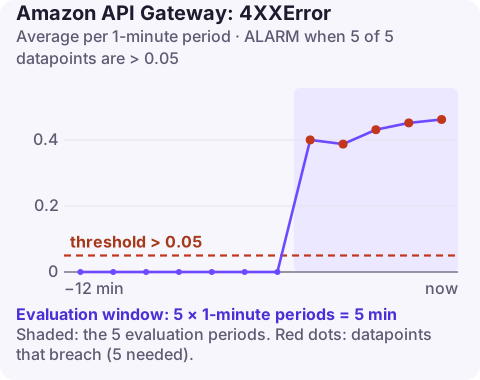
What 4XXError measures
For every request a REST API stage handles, API Gateway records 4XXError as 1 if the response status was in the 400 range and 0 otherwise. That makes the statistic you pick matter: Sum gives you the number of client errors, while Average gives you the share of all requests that failed on the client side. The recommended alarm uses the share, so a traffic spike on its own does not trip it.
"Client-side" is API Gateway's view, not necessarily the truth. A 403 from a broken authorizer, a 429 from your own stage throttling or usage plan, and a 404 because a deploy removed a resource all land here, even though the fix is on your side.
Recommended alarm settings
| Setting | Value |
|---|---|
| Namespace | AWS/ApiGateway |
| Metric | 4XXError |
| Dimensions | ApiName, Stage |
| Statistic | Average |
| Period | 60 seconds |
| Datapoints to alarm | 5 |
| Evaluation periods | 5 |
| Comparison operator | GreaterThanThreshold |
| Threshold | 0.05: 5% of requests |
Source: the CloudWatch recommended alarms list for API Gateway. ApiName is the REST API's name, not its ID, and Stage is the stage name such as prod.
Why these settings, and how to tune them
- Five consecutive minutes above 5% filters out a single misbehaving client retrying a bad token for a minute, but still pages you within about five minutes of a real regression.
- Know your baseline before you trust 5%. Some APIs legitimately return lots of 404s (lookups by ID) or 401s (expired sessions). Plot
Averageof4XXErrorover the last two weeks; set the threshold comfortably above the normal daily peak rather than on the median. - Low-traffic stages are noisy. Ten requests a minute with one 404 is already 10%. Either raise the threshold, alarm on
Suminstead, or add a metric-math condition that also requires a minimum requestCount. - Missing data: a stage with no requests in a minute publishes nothing. Treat missing data as
notBreachingso quiet nights don't leave the alarm inINSUFFICIENT_DATA. - Per-method alarms need detailed CloudWatch metrics turned on for the stage; they add the
ResourceandMethoddimensions and cost extra custom-metric charges.
Create it with the AWS CLI
aws cloudwatch put-metric-alarm \
  --alarm-name orders-api-prod-4xx-rate \
  --namespace AWS/ApiGateway \
  --metric-name 4XXError \
  --dimensions Name=ApiName,Value=orders-api Name=Stage,Value=prod \
  --statistic Average \
  --period 60 \
  --evaluation-periods 5 \
  --datapoints-to-alarm 5 \
  --threshold 0.05 \
  --comparison-operator GreaterThanThreshold \
  --treat-missing-data notBreaching \
  --alarm-actions arn:aws:sns:eu-west-2:123456789012:ops-alerts \
  --region eu-west-2
Swap the SNS topic ARN for your own. The same values work in CloudFormation's AWS::CloudWatch::Alarm resource.
When the alarm fires
- Split by status code. Turn on access logging with
$context.statusin the format if it is not already, then count by status in Logs Insights. A wall of 403s is an auth problem, 429s are throttling, 404s are routing. - Check what changed. A deployment that renamed a resource path or tightened a request validator is the classic cause; compare the stage's deployment time with the start of the spike.
- For 429s, compare stage and method throttle settings and any usage-plan limits with the request rate; the re:Post article on API Gateway 429 errors walks through it.
- For 403s, look at the authorizer: an expired signing key, an IAM policy change or a Lambda authorizer that is itself failing. See 403 Forbidden from API Gateway and Missing Authentication Token.
- Find the caller. Group the errors by source IP or API key; one broken client release often accounts for nearly all of them.
Questions
Is 4XXError a count or a rate?
Both, depending on the statistic. Sum gives the number of 4xx responses in the period; Average gives the fraction of requests that were 4xx, which is what the 0.05 threshold expects.
Does 4XXError include 429 throttling?
Yes. Requests rejected by stage, method or usage-plan throttling return 429 and count as 4XXError, so a throttling problem can trigger this alarm.
Should I alarm on 4XXError at all?
Yes, but loosely. Sustained client errors usually mean a broken deploy, auth change or client release; a single bad caller should not wake anyone, which is why the alarm needs five breaching minutes.
A 4xx spike usually shows up right after someone else's release, often outside your working hours. CloudConsole, a phone app for AWS, is built to put the alarm, the API's recent deployments and the matching log lines on one phone screen.
Did it start after a deploy? What changed? on the app’s alarm screen lists the deploys and configuration changes from the hour before the alarm fired.
About the app → · Download on the App Store