 CloudConsole
aws cloudwatch put-metric-alarm
aws cloudwatch put-metric-alarm creates an alarm, or replaces an existing one with the same name, from a metric, statistic, period, threshold and comparison operator. Add --alarm-actions with an SNS topic ARN to be notified, --datapoints-to-alarm to require M of N breaching periods, and --treat-missing-data to decide what silence means.
What the command does
The alarm evaluates its metric every period. When the configured number of datapoints breach the threshold within the evaluation window, it moves to ALARM and runs its alarm actions: SNS notifications, Auto Scaling policies, EC2 stop/terminate/reboot/recover actions, or Systems Manager actions. It runs OK actions on the way back.
The call is an upsert: calling it again with an existing name replaces the whole definition, and any option you leave out goes back to its default.
Syntax
aws cloudwatch put-metric-alarm --alarm-name <name> \
  --namespace <ns> --metric-name <metric> \
  --dimensions Name=<dim>,Value=<value> \
  --statistic Average|Sum|Minimum|Maximum|SampleCount  (or --extended-statistic p99) \
  --period 60 --evaluation-periods 5 [--datapoints-to-alarm 3] \
  --threshold 80 --comparison-operator GreaterThanOrEqualToThreshold \
  [--treat-missing-data missing|notBreaching|breaching|ignore] \
  [--alarm-actions <arn>] [--ok-actions <arn>] [--alarm-description "..."]
Worked examples
EC2 CPU above 80% for 3 of the last 5 minutes:
aws cloudwatch put-metric-alarm --alarm-name prod-web-1-cpu-high \
  --namespace AWS/EC2 --metric-name CPUUtilization \
  --dimensions Name=InstanceId,Value=i-0123456789abcdef0 \
  --statistic Average --period 60 \
  --evaluation-periods 5 --datapoints-to-alarm 3 \
  --threshold 80 --comparison-operator GreaterThanThreshold \
  --alarm-actions arn:aws:sns:eu-west-2:123456789012:oncall \
  --ok-actions arn:aws:sns:eu-west-2:123456789012:oncall
Any Lambda errors in five minutes, treating no data as healthy:
aws cloudwatch put-metric-alarm --alarm-name checkout-errors \
  --namespace AWS/Lambda --metric-name Errors \
  --dimensions Name=FunctionName,Value=checkout \
  --statistic Sum --period 300 --evaluation-periods 1 \
  --threshold 0 --comparison-operator GreaterThanThreshold \
  --treat-missing-data notBreaching \
  --alarm-actions arn:aws:sns:eu-west-2:123456789012:oncall
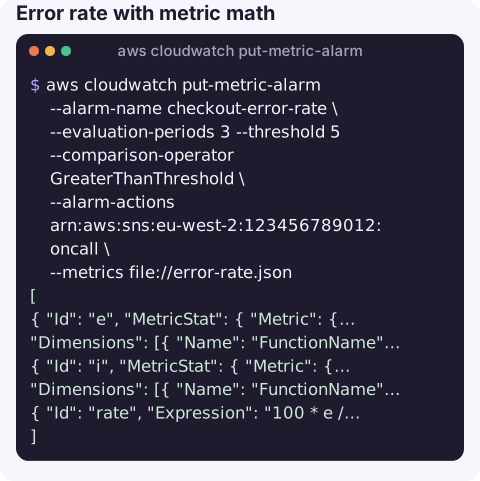
Error rate with metric math (errors as a percentage of invocations):
aws cloudwatch put-metric-alarm --alarm-name checkout-error-rate \
  --evaluation-periods 3 --threshold 5 --comparison-operator GreaterThanThreshold \
  --alarm-actions arn:aws:sns:eu-west-2:123456789012:oncall \
  --metrics file://error-rate.json
[
{ "Id": "e", "MetricStat": { "Metric": { "Namespace": "AWS/Lambda", "MetricName": "Errors",
"Dimensions": [{ "Name": "FunctionName", "Value": "checkout" }] }, "Period": 300, "Stat": "Sum" }, "ReturnData": false },
{ "Id": "i", "MetricStat": { "Metric": { "Namespace": "AWS/Lambda", "MetricName": "Invocations",
"Dimensions": [{ "Name": "FunctionName", "Value": "checkout" }] }, "Period": 300, "Stat": "Sum" }, "ReturnData": false },
{ "Id": "rate", "Expression": "100 * e / i", "Label": "Error %", "ReturnData": true }
]Recover an instance automatically on a failed system status check:
aws cloudwatch put-metric-alarm --alarm-name web-1-auto-recover \
  --namespace AWS/EC2 --metric-name StatusCheckFailed_System \
  --dimensions Name=InstanceId,Value=i-0123456789abcdef0 \
  --statistic Maximum --period 60 --evaluation-periods 2 \
  --threshold 0 --comparison-operator GreaterThanThreshold \
  --alarm-actions arn:aws:automate:eu-west-2:ec2:recover
Missing data options
--treat-missing-data | Use for |
|---|---|
missing (default) | Ignore gaps when evaluating; the alarm can go to INSUFFICIENT_DATA if all data is missing. |
notBreaching | Error counts and other metrics that only report when something happens. |
breaching | Heartbeats where silence itself is the problem. |
ignore | Keep the current state until real data arrives. |
Gotchas
- Dimensions must match exactly, including every dimension the metric is published with. A partial match reads as no data.
- Updating wipes unspecified settings. Re-running with fewer options silently removes actions or descriptions. Read the current definition with
describe-alarmsfirst. - Periods. Use multiples of 60 for standard metrics; 10 or 30 seconds only work with high-resolution metrics.
- Same-region SNS topics. Alarm actions must target resources in the alarm's region.
- Test it with
set-alarm-stateso you know notifications actually reach someone.
Questions
How do I create a CloudWatch alarm from the CLI?
Use aws cloudwatch put-metric-alarm with the metric, dimensions, statistic, period, evaluation periods, threshold, comparison operator and an SNS topic in --alarm-actions.
Does put-metric-alarm overwrite an existing alarm?
Yes. The same alarm name replaces the whole definition, so include every setting you want to keep.
What is the difference between put-metric-alarm and put-metric-data?
put-metric-alarm creates an alarm that watches a metric. put-metric-data publishes datapoints to a custom metric.
An alarm is only useful if it reaches you, wherever you are. CloudConsole, a phone app for AWS, is built to show alarms, the metric behind them and related logs on a phone.
About the app → · Download on the App Store