 CloudConsole
CloudWatch alarm for API Gateway 5xx (HTTP API)
Create an alarm on the HTTP API metric 5xx, dimensions ApiId and Stage, using Average, which equals the server-error rate. AWS recommends alarming when it is above 0.05 for 3 of 3 one-minute periods.
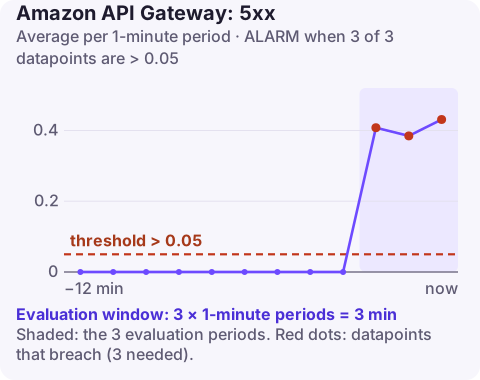
What 5xx means on an HTTP API
Each request to the stage records 1 in 5xx if the response was a server error and 0 if not; the per-minute Average is therefore the fraction of requests that failed on the server side. That includes errors your integration returned and errors API Gateway produced on its behalf, most often:
- 500 Internal Server Error where the access log's
$context.integrationErrorMessageexplains why the integration could not be called, for example a Lambda permission problem. - 503 Service Unavailable from a private integration whose VPC link or target is unhealthy.
- 504 Gateway Timeout when the integration exceeded its timeout (30 seconds maximum for HTTP APIs at the time of writing).
Recommended settings
| Setting | Value |
|---|---|
| Namespace | AWS/ApiGateway |
| Metric | 5xx |
| Dimensions | ApiId, Stage |
| Statistic | Average |
| Period | 60 seconds |
| Datapoints to alarm | 3 |
| Evaluation periods | 3 |
| Comparison operator | GreaterThanThreshold |
| Threshold | 0.05: server errors on more than 5% of requests |
These match the CloudWatch recommended alarms list. The REST API equivalent uses a different metric name and dimension; see API Gateway 5XXError alarm.
Tuning
- Start from history. Pull a fortnight of one-minute
Averagevalues for5xx. If your quiet-day rate is 0.2%, a 5% threshold waits for a very large outage; 1% is a more honest page. - Keep three datapoints. Shortening to one minute catches every cold-start burst; lengthening it past five delays the page during real incidents.
- Watch out for low volume. On stages that handle a few requests a minute, one failure is a big percentage. Combine the rate with a minimum
Countusing metric math if this bites. - Missing data should be
notBreaching.
Create it from the CLI
aws cloudwatch put-metric-alarm \
  --alarm-name shop-http-api-5xx-rate \
  --namespace AWS/ApiGateway \
  --metric-name 5xx \
  --dimensions Name=ApiId,Value=a1b2c3d4e5 Name=Stage,Value=prod \
  --statistic Average \
  --period 60 \
  --evaluation-periods 3 \
  --datapoints-to-alarm 3 \
  --threshold 0.05 \
  --comparison-operator GreaterThanThreshold \
  --treat-missing-data notBreaching \
  --alarm-actions arn:aws:sns:eu-west-2:123456789012:ops-alerts \
  --region eu-west-2
Find the ApiId with aws apigatewayv2 get-apis. Metrics appear only for stages that have received traffic.
Triage when it fires
- Read the access log for a failing request. With
$context.integrationErrorMessageand$context.integration.statusin the log format you can see whether the backend answered with a 5xx or never answered. - Lambda integration: check the function's
Errors,ThrottlesandDuration. A throttled function surfaces as server errors to clients. - Private integration: check target health on the load balancer behind the VPC link.
- HTTP integration to the internet: test the backend URL directly; DNS or TLS problems on the backend show up only as 5xx at the API.
- Rule out a deploy by comparing the incident start with the stage's last deployment.
The re:Post guide to API Gateway 5xx errors lists more causes.
Questions
What is the difference between 5xx and 5XXError in CloudWatch?
5xx is the HTTP API metric, keyed by ApiId; 5XXError is the REST API metric, keyed by ApiName. Both are server-error rates when you use the Average statistic.
How do I see which route is returning 5xx?
Turn on detailed metrics for the stage to get per-route data, or add $context.routeKey to the access log format and group by it in Logs Insights.
Why 0.05 average?
The Average of 5xx is the fraction of requests that failed, so 0.05 means 5%. Lower it once you know your normal error rate.
When this alarm goes off you mostly need to know whether the backend or the API layer is failing. CloudConsole, a phone app for AWS, is built to show the alarm, the integration's own metrics and the access logs side by side on a phone.
Did it start after a deploy? What changed? on the app’s alarm screen lists the deploys and configuration changes from the hour before the alarm fired.
About the app → · Download on the App Store