 CloudConsole
CloudWatch alarm for API Gateway Latency (HTTP API stage)
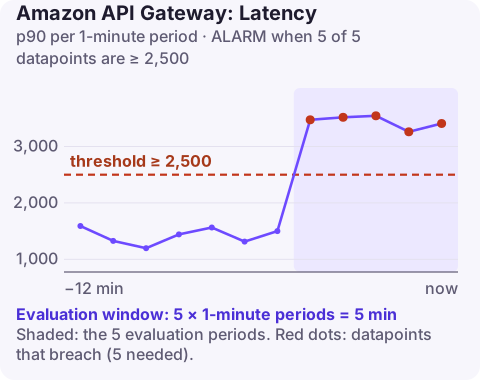
For HTTP APIs, alarm on Latency at p90 with the ApiId and Stage dimensions when it is at or above 2,500 ms for 5 of 5 one-minute periods. Because HTTP APIs add little processing of their own, a rise is usually the integration or a Lambda authorizer; IntegrationLatency tells you which.
What Latency includes on an HTTP API
On an HTTP API, Latency is the full time from receiving a request to returning the response, and IntegrationLatency is the part spent waiting for the backend. HTTP APIs have no request mapping templates or response caching, so the gap between the two is normally small and made up mostly of:
- Lambda authorizers, especially with caching turned off or a very short TTL, so every request waits for the authorizer;
- JWT authorizers fetching the issuer's signing keys;
- network time to private integrations behind a VPC link.
For REST APIs the equivalent alarm uses ApiName: see API Gateway Latency alarm (REST).
Recommended settings
| Setting | Value |
|---|---|
| Namespace | AWS/ApiGateway |
| Metric | Latency |
| Dimensions | ApiId, Stage |
| Statistic | p90 |
| Period | 60 seconds |
| Datapoints to alarm | 5 |
| Evaluation periods | 5 |
| Comparison operator | GreaterThanOrEqualToThreshold |
| Threshold | 2500.0 (milliseconds) |
From the CloudWatch recommended alarms reference. AWS treats this as the main latency alarm for HTTP APIs, with IntegrationLatency as optional.
Tuning
HTTP APIs mostly front Lambda functions and containers that answer in tens or hundreds of milliseconds, so 2,500 ms is a late warning for many of them. To pick your own figure, chart p50, p90 and p99 for 14 days. A healthy API usually shows p90 a small multiple of p50. Set the threshold at about twice the normal p90 peak, and check that it is still below the point where clients start timing out (HTTP APIs stop waiting for an integration after 30 seconds at most).
If cold starts make the first requests after a quiet period slow, you will see brief p90 spikes; the five-minute window usually absorbs them. Leave missing data as notBreaching.
Create it
aws cloudwatch put-metric-alarm \
  --alarm-name shop-http-api-p90-latency \
  --namespace AWS/ApiGateway \
  --metric-name Latency \
  --dimensions Name=ApiId,Value=a1b2c3d4e5 Name=Stage,Value=prod \
  --extended-statistic p90 \
  --period 60 \
  --evaluation-periods 5 \
  --datapoints-to-alarm 5 \
  --threshold 2500 \
  --comparison-operator GreaterThanOrEqualToThreshold \
  --treat-missing-data notBreaching \
  --alarm-actions arn:aws:sns:eu-west-2:123456789012:ops-alerts \
  --region eu-west-2
On stages with very little traffic, also pass --evaluate-low-sample-count-percentile ignore so a single slow request does not decide the p90.
When it fires
- Plot
LatencyandIntegrationLatencytogether at p90. Matching curves send you to the backend; a growing gap sends you to the authorizer. - Lambda backend: check
Durationand throttles for the function, and whether a new version raised initialisation time. The re:Post guide to latency with Lambda integrations helps. - Authorizer: check the authorizer function's duration and its result TTL.
- Which route? Put
$context.routeKeyand$context.responseLatencyin the access log and rank routes by p90 in Logs Insights.
Questions
Is there an IntegrationLatency alarm for HTTP APIs?
You can create one, but AWS considers it optional for HTTP APIs because the Latency alarm already covers the backend time.
What is the maximum integration timeout for HTTP APIs?
At the time of writing, 30 seconds. Requests whose integration takes longer return 504 to the client.
Why does my p90 latency spike at night?
Usually cold starts after idle periods combined with low traffic, where a few slow requests decide the percentile.
A latency alarm on a phone is only useful if you can see whether the backend or the authorizer is to blame. CloudConsole, a phone app for AWS, is built to show both latency curves on the alarm screen.
Did it start after a deploy? What changed? on the app’s alarm screen lists the deploys and configuration changes from the hour before the alarm fired.
About the app → · Download on the App Store