 CloudConsole
CloudWatch alarm for API Gateway 4xx (HTTP API)
For an HTTP API, the client-error metric is called 4xx (lower case) and is keyed by ApiId and Stage. AWS recommends alarming when its Average, the share of requests answered with a 4xx, is greater than 0.05 for 5 of 5 one-minute periods.
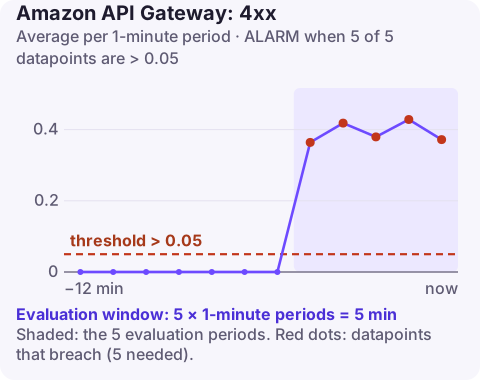
HTTP API 4xx versus REST API 4XXError
HTTP APIs and REST APIs publish to the same AWS/ApiGateway namespace but with different names and keys. Mixing them up is the usual reason a new alarm sits in INSUFFICIENT_DATA forever.
| HTTP API | REST API | |
|---|---|---|
| Metric name | 4xx | 4XXError |
| Identifies the API by | ApiId (e.g. a1b2c3d4e5) | ApiName |
| Per-route breakdown | Detailed metrics, by route | Detailed metrics, by resource and method |
Like its REST counterpart, each request records 1 for a 4xx response and 0 otherwise, so Average is an error rate. For the REST version see API Gateway 4XXError alarm.
Recommended settings
| Setting | Value |
|---|---|
| Namespace | AWS/ApiGateway |
| Metric | 4xx |
| Dimensions | ApiId, Stage |
| Statistic | Average |
| Period | 60 seconds |
| Datapoints to alarm | 5 |
| Evaluation periods | 5 |
| Comparison operator | GreaterThanThreshold |
| Threshold | 0.05: a 5% client-error rate |
Taken from the CloudWatch recommended alarms reference. The Stage value for the auto-deploying default stage is $default.
Choosing your own threshold
HTTP APIs are often used behind JWT authorizers, where a mobile app holding an expired token produces a steady trickle of 401s. Before accepting 5%:
- Chart
Averageof4xxnext toCountfor the stage over two weeks. If the rate jumps whenever traffic is very low, that is noise from a handful of requests, not a problem. - Put the threshold just above the busiest-hour peak you consider healthy.
- If a few known callers always misbehave, a per-route alarm on the routes that matter is cleaner than raising the stage-wide threshold.
Set missing data to notBreaching; an idle stage publishes nothing.
Create the alarm
# Find the API ID and stage names first
aws apigatewayv2 get-apis --query "Items[].{id:ApiId,name:Name}" --output table
aws apigatewayv2 get-stages --api-id a1b2c3d4e5 --query "Items[].StageName"
aws cloudwatch put-metric-alarm \
--alarm-name shop-http-api-4xx-rate \
--namespace AWS/ApiGateway \
--metric-name 4xx \
--dimensions Name=ApiId,Value=a1b2c3d4e5 Name=Stage,Value='$default' \
--statistic Average \
--period 60 \
--evaluation-periods 5 \
--datapoints-to-alarm 5 \
--threshold 0.05 \
--comparison-operator GreaterThanThreshold \
--treat-missing-data notBreaching \
--alarm-actions arn:aws:sns:eu-west-2:123456789012:ops-alerts \
--region eu-west-2When it fires
- Look at the status mix in the stage's access logs (configure a JSON format with
$context.status,$context.routeKeyand$context.error.message). 404 with arouteKeyof-means no route matched. - 401 or 403 bursts point at the JWT authorizer: issuer or audience mismatch after an identity-provider change, or a client sending tokens for the wrong app.
- 429s mean the stage or route throttling limits, or the account-level Region limit, were hit; the re:Post article on 429 errors applies here too.
- Correlate with deploys: a route removed or renamed in the latest deployment shows up as an immediate 404 wall.
Related: CORS errors with API Gateway, which surface in browsers but often as 4xx on preflight requests.
Questions
Why is my HTTP API 4XXError alarm showing insufficient data?
HTTP APIs do not publish 4XXError. Their metric is 4xx with the ApiId and Stage dimensions; an alarm using the REST metric name or ApiName never receives data.
What Stage value do I use for the default stage?
Use $default, quoted in the shell so it is not expanded as a variable.
Does the 4xx metric include throttled requests?
Yes. A request rejected by throttling returns 429, which counts towards 4xx.
Client-error spikes on an HTTP API often follow a mobile app release you didn't ship. CloudConsole, a phone app for AWS, is built to show the alarm next to the route-level logs so you can judge quickly whether it is yours to fix.
Did it start after a deploy? What changed? on the app’s alarm screen lists the deploys and configuration changes from the hour before the alarm fired.
About the app → · Download on the App Store