 CloudConsole
CloudWatch alarm for API Gateway ClientError (WebSocket API)
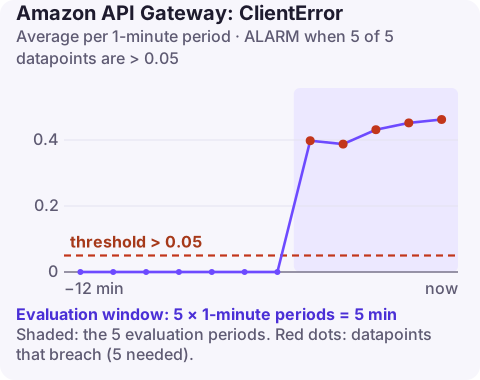
ClientError counts WebSocket API requests that API Gateway rejected with a 4xx before or instead of calling the integration. AWS recommends an alarm on its Average for an ApiId and Stage, firing when it is greater than 0.05 for 5 consecutive one-minute periods.
What ClientError covers on a WebSocket API
WebSocket APIs do not have a 4xx metric. Instead, client-side failures are reported as ClientError, separate from IntegrationError (the backend returned an error) and ExecutionError (calling the backend failed). Typical sources:
- Rejected
$connectrequests: a Lambda or IAM authorizer denied the connection, or the request was missing a required header or query string. - Messages to a route that does not exist when there is no
$defaultroute to catch them, or a route selection expression that does not match the payload. - Throttled messages once the stage, route or account limit is exceeded.
- Oversized frames or messages beyond the WebSocket API limits.
Recommended settings
| Setting | Value |
|---|---|
| Namespace | AWS/ApiGateway |
| Metric | ClientError |
| Dimensions | ApiId, Stage |
| Statistic | Average |
| Period | 60 seconds |
| Datapoints to alarm | 5 |
| Evaluation periods | 5 |
| Comparison operator | GreaterThanThreshold |
| Threshold | 0.05: AWS describes this as 5% of requests failing |
From the CloudWatch recommended alarms page. AWS applies the same 5% logic as the REST and HTTP client-error alarms; before relying on it, chart Average, Sum and SampleCount of ClientError together for your API to confirm the average behaves as a rate.
Tuning for WebSocket traffic
WebSocket traffic is bursty in a way REST traffic is not: thousands of clients reconnect at once after a deploy or a network blip, and each reconnect that presents a stale token is a client error. That creates short, tall spikes.
- Keep the five-of-five window so a reconnect storm that clears in two minutes does not page you.
- If expired-token reconnects are routine, raise the threshold until a normal reconnect wave stays under it, and fix the client to refresh before reconnecting.
- Use per-route alarms (detailed metrics) for the routes that carry business messages, so a noisy
$connectroute does not mask them. - Treat missing data as
notBreaching.
Create it
aws cloudwatch put-metric-alarm \
  --alarm-name chat-ws-prod-client-errors \
  --namespace AWS/ApiGateway \
  --metric-name ClientError \
  --dimensions Name=ApiId,Value=w1x2y3z4a5 Name=Stage,Value=prod \
  --statistic Average \
  --period 60 \
  --evaluation-periods 5 \
  --datapoints-to-alarm 5 \
  --threshold 0.05 \
  --comparison-operator GreaterThanThreshold \
  --treat-missing-data notBreaching \
  --alarm-actions arn:aws:sns:eu-west-2:123456789012:ops-alerts \
  --region eu-west-2
What to check when it fires
- Enable execution or access logging on the stage and include
$context.routeKey,$context.eventTypeand$context.error.message. The route key tells you whether failures are onCONNECTor onMESSAGEevents. - Connect failures: invoke the authorizer with a real token and read its decision; check for a changed issuer, key rotation or a cached deny.
- Message failures: confirm the clients' message shape still matches the route selection expression (for example
$request.body.action). - 429s: compare the message rate with your throttling settings; the re:Post article on API Gateway 429 errors applies.
- Connection drops are covered in the re:Post guide to WebSocket API errors.
Questions
Is ClientError the same as 4xx for WebSocket APIs?
It plays the same role. WebSocket APIs report client-side failures as ClientError; the 4xx metric belongs to HTTP APIs and 4XXError to REST APIs.
Can I alarm on ClientError per route?
Yes, if you enable detailed CloudWatch metrics on the stage. That adds a Route dimension so you can alarm on, for example, the sendmessage route on its own.
Why do I get ClientError spikes after a deploy?
Clients reconnect when connections drop, and any that present expired tokens or old message formats fail at once. If the spike clears in a minute or two, it is usually reconnection noise.
WebSocket problems tend to show up as a wave of reconnects, which looks alarming on a graph and may be harmless. CloudConsole, a phone app for AWS, is built to show the alarm with the route-level breakdown so you can tell the two apart from your phone.
Did it start after a deploy? What changed? on the app’s alarm screen lists the deploys and configuration changes from the hour before the alarm fired.
About the app → · Download on the App Store