 CloudConsole
CloudWatch alarm for API Gateway MessageCount (WebSocket API stage)
MessageCount counts messages flowing through a WebSocket API stage, both from clients and to them. AWS recommends alarming when its SampleCount for an ApiId and Stage is below a threshold you choose for 10 of 10 one-minute periods, on APIs whose message volume is steady enough to have a reliable floor.
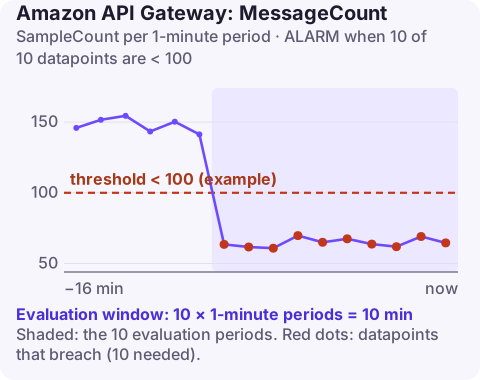
What a drop in MessageCount tells you
A WebSocket API can be "up" in every sense CloudWatch normally measures while being useless: clients connect, but nothing flows. MessageCount includes messages clients send to the API and messages your backend pushes to clients through the @connections management API, so a fall can mean either side broke:
- Clients cannot connect:
$connectauthorizer failing, a custom domain problem, clients pointed at the wrong stage. - Clients connect but go quiet: a client release that stops sending a heartbeat or subscription message.
- Your backend stopped pushing: the service that calls
PostToConnectionlost its IAM permission, crashed, or its queue stalled.
Compare ConnectCount for the same minutes to tell the first case from the other two.
Recommended settings
| Setting | Value |
|---|---|
| Namespace | AWS/ApiGateway |
| Metric | MessageCount |
| Dimensions | ApiId, Stage |
| Statistic | SampleCount |
| Period | 60 seconds |
| Datapoints to alarm | 10 |
| Evaluation periods | 10 |
| Comparison operator | LessThanThreshold |
| Threshold | Depends on your situation: derive from historical message volume |
From the CloudWatch recommended alarms page. AWS advises skipping it for APIs without consistent traffic.
Setting the threshold
Message volume on a WebSocket API usually follows the number of connected users, so it has a strong daily curve. One way to set a static floor:
- Query a week of one-minute
SampleCountforMessageCountwith get-metric-data. - Find the 1st percentile of those minutes (the quietest 1% of healthy minutes).
- Use about half that value. Anything lower would require most of your users to vanish at once.
If heartbeats keep volume steady, the floor can be quite high and the alarm very sensitive to real failures. If your API is idle at night, consider anomaly detection or enabling the alarm's actions only during active hours.
Create it
# 100 messages/minute is an example floor
aws cloudwatch put-metric-alarm \
  --alarm-name live-ws-prod-low-messages \
  --namespace AWS/ApiGateway \
  --metric-name MessageCount \
  --dimensions Name=ApiId,Value=w1x2y3z4a5 Name=Stage,Value=prod \
  --statistic SampleCount \
  --period 60 \
  --evaluation-periods 10 \
  --datapoints-to-alarm 10 \
  --threshold 100 \
  --comparison-operator LessThanThreshold \
  --treat-missing-data breaching \
  --alarm-actions arn:aws:sns:eu-west-2:123456789012:ops-alerts \
  --region eu-west-2
Without --treat-missing-data breaching, a stage with no messages at all publishes nothing and the alarm never reaches ALARM.
When it fires
- Look at ConnectCount. If connects also fell, test a connection yourself with a WebSocket client against the stage URL and read the handshake response.
- If connects are normal, check the backend that pushes messages: its logs, its
execute-api:ManageConnectionspermission and anyGoneExceptionresponses suggesting it is sending to stale connection IDs. - Check
ExecutionErrorandIntegrationError; client messages that fail before reaching the backend may never be answered. - The re:Post guide to WebSocket API errors covers connection-level faults.
Questions
Does MessageCount include messages sent from the server?
Yes. It counts messages in both directions, including those your backend posts to clients through the @connections API.
What is the difference between MessageCount and ConnectCount?
ConnectCount counts $connect route requests; MessageCount counts messages exchanged over open connections. Watching both shows whether clients are failing to connect or connecting and then going quiet.
Can I monitor MessageCount per route?
Yes, with detailed metrics enabled on the stage, which add a Route dimension.
A real-time feature that stops delivering messages rarely throws errors you would notice. CloudConsole, a phone app for AWS, is built to put this alarm and the connection graphs next to each other on a phone.
Did it start after a deploy? What changed? on the app’s alarm screen lists the deploys and configuration changes from the hour before the alarm fired.
About the app → · Download on the App Store