 CloudConsole
CloudWatch alarm for API Gateway IntegrationLatency (ApiId, Stage)
Alarm on the p90 of IntegrationLatency for an ApiId and Stage when it is at or above 2,000 ms for 5 of 5 one-minute periods. AWS recommends it for WebSocket APIs, which have no Latency metric, and treats it as optional for HTTP APIs, where the Latency alarm already covers backend time.
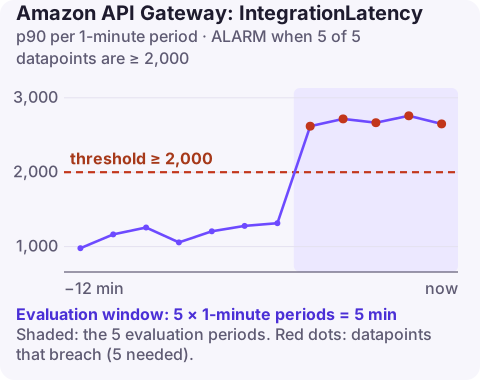
What IntegrationLatency measures
IntegrationLatency is the time from API Gateway sending a request to your backend until it receives the backend's response. It excludes anything API Gateway does before or after, such as authorisation. That makes it the cleanest measure of how fast your Lambda function, HTTP endpoint or AWS service integration is answering.
Why AWS treats it differently by API type:
| API type | Has a Latency metric? | This alarm |
|---|---|---|
| WebSocket | No | Recommended: it is your main backend-speed signal |
| HTTP | Yes | Optional; useful for separating backend from gateway time |
On a WebSocket API it is recorded for messages that invoke an integration, including $connect when that route has one. On an HTTP API, the alarm earns its place when you want an unambiguous answer to "is it us or the backend?": if Latency is high but IntegrationLatency is not, the extra time is in authorisation or the gateway itself, and paging the backend team would be the wrong move.
Recommended settings
| Setting | Value |
|---|---|
| Namespace | AWS/ApiGateway |
| Metric | IntegrationLatency |
| Dimensions | ApiId, Stage |
| Statistic | p90 |
| Period | 60 seconds |
| Datapoints to alarm | 5 |
| Evaluation periods | 5 |
| Comparison operator | GreaterThanOrEqualToThreshold |
| Threshold | 2000.0 (milliseconds) |
As listed in AWS's CloudWatch recommended alarms. The threshold is lower than the 2,500 ms used for Latency because it measures only part of the request.
Tuning
Start from what the backend normally does. For a Lambda integration, the function's p90 Duration is a good predictor: IntegrationLatency is usually that plus a little invocation overhead. Set the threshold at roughly twice the healthy p90, capped by your user-facing expectation. For a WebSocket chat or game backend that should answer in under 200 ms, 2,000 ms is a very late alarm.
For quiet APIs, add --evaluate-low-sample-count-percentile ignore so that a minute with three messages, one of which hit a cold start, does not count. Missing data should be notBreaching.
Create it
aws cloudwatch put-metric-alarm \
  --alarm-name chat-ws-prod-integration-p90 \
  --namespace AWS/ApiGateway \
  --metric-name IntegrationLatency \
  --dimensions Name=ApiId,Value=w1x2y3z4a5 Name=Stage,Value=prod \
  --extended-statistic p90 \
  --period 60 \
  --evaluation-periods 5 \
  --datapoints-to-alarm 5 \
  --threshold 2000 \
  --comparison-operator GreaterThanOrEqualToThreshold \
  --treat-missing-data notBreaching \
  --alarm-actions arn:aws:sns:eu-west-2:123456789012:ops-alerts \
  --region eu-west-2
When it fires
- Correlate with the backend's own metric. For Lambda, plot the function's
Durationp90 next toIntegrationLatency. If they match, the slowness is in the function; ifIntegrationLatencyis much higher, look at cold starts (Init Durationin REPORT lines) or throttling and retries. - Look downstream. Database or third-party API slowness is the usual reason function duration grows.
- Find the route. Enable detailed metrics and use the per-route IntegrationLatency alarm for the routes that matter.
- Check the stage's logs for integration errors that coincide with the slow period.
Questions
What is the difference between Latency and IntegrationLatency in API Gateway?
Latency is the whole request as seen by API Gateway; IntegrationLatency is only the time spent waiting for the backend. The gap is API Gateway's own processing, such as authorisers.
Do WebSocket APIs have a Latency metric?
No. WebSocket APIs publish IntegrationLatency but not Latency, which is why AWS recommends this alarm for them.
Why is IntegrationLatency higher than my Lambda Duration?
It also includes invocation overhead and any cold-start initialisation, which Duration does not fully show.
For a WebSocket API this alarm is often the first sign users are waiting. CloudConsole, a phone app for AWS, is built to show it alongside the backend function's duration on one phone screen.
Did it start after a deploy? What changed? on the app’s alarm screen lists the deploys and configuration changes from the hour before the alarm fired.
About the app → · Download on the App Store