 CloudConsole
API Gateway MessageCount alarm per WebSocket route
This alarm narrows the WebSocket low-traffic check to a single route using the ApiId, Stage and Route dimensions, which require detailed metrics on the stage. It fires when the SampleCount of MessageCount for that route stays below your threshold for 10 of 10 one-minute periods.
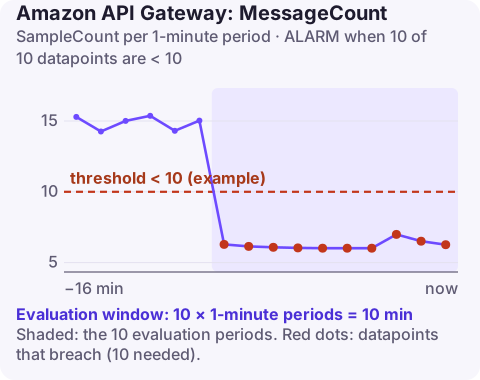
Route-level versus stage-level
On a WebSocket API most volume often comes from one chatty route, such as a heartbeat or presence update. If the route that carries real work (say placeOrder or sendMessage) breaks, the stage-level MessageCount alarm barely moves. The per-route alarm watches that route alone.
| Use the stage alarm when | Use the route alarm when |
|---|---|
| You want one cheap outage signal for the whole API | A specific route carries business-critical messages |
| Detailed metrics are off | Detailed metrics are on (extra cost per route) |
| Routes have similar volume | One noisy route would hide a failure in another |
Recommended settings
| Setting | Value |
|---|---|
| Namespace | AWS/ApiGateway |
| Metric | MessageCount |
| Dimensions | ApiId, Stage, Route |
| Statistic | SampleCount |
| Period | 60 seconds |
| Datapoints to alarm | 10 |
| Evaluation periods | 10 |
| Comparison operator | LessThanThreshold |
| Threshold | Depends on your situation: from that route's historical volume |
As listed in the CloudWatch recommended alarms reference. The Route value is the route key, for example sendMessage, or the reserved keys $connect, $disconnect and $default.
Choosing a per-route threshold
Routes driven by user actions are far spikier than heartbeat routes, so a floor that works for the stage is wrong here. A method that copes with that:
- Plot the route's one-minute counts against the stage's for a week.
- If the route's share of stage traffic is stable (for example,
sendMessageis always 10–15% of messages), a metric-math ratio alarm is more robust than a raw count. - If you stay with the raw count, set it under the route's lowest healthy minute and accept that it will only catch a near-complete stop.
- Routes with idle minutes are poor candidates; use a longer period or a synthetic client that sends a test message every minute.
Create it
# Enable detailed metrics for all routes on the stage
aws apigatewayv2 update-stage --api-id w1x2y3z4a5 --stage-name prod \
  --default-route-settings DetailedMetricsEnabled=true
# Example floor of 10 messages per minute on the sendMessage route
aws cloudwatch put-metric-alarm \
--alarm-name chat-ws-sendmessage-low \
--namespace AWS/ApiGateway \
--metric-name MessageCount \
--dimensions Name=ApiId,Value=w1x2y3z4a5 Name=Stage,Value=prod Name=Route,Value=sendMessage \
--statistic SampleCount \
--period 60 \
--evaluation-periods 10 \
--datapoints-to-alarm 10 \
--threshold 10 \
--comparison-operator LessThanThreshold \
--treat-missing-data breaching \
--alarm-actions arn:aws:sns:eu-west-2:123456789012:ops-alerts \
--region eu-west-2When it fires
- Is the route still matched? Clients may have changed the field that the route selection expression reads (for instance renaming
action), so their messages fall through to$default. A rising$defaultcount at the same moment confirms it. - Is the integration erroring? Check
IntegrationErrorandExecutionErrorfor the route. - Is the feature in use? Rule out a front-end change that hid or removed the feature that sends this message.
- Check route-level throttling settings; a very low route limit produces client errors instead of messages.
Questions
What is the Route dimension value for a WebSocket API?
The route key, such as sendMessage, or one of the reserved keys $connect, $disconnect and $default.
Why is my route-level MessageCount alarm empty?
Detailed metrics are probably not enabled on the stage, or the route has had no traffic since they were.
Should I alarm on $default traffic?
A sudden rise in $default can be more useful than a drop: it often means clients are sending messages that no longer match their intended route.
When a single WebSocket route breaks, the API looks fine at a glance. CloudConsole, a phone app for AWS, is built to show per-route alarms and message graphs on a phone so you can see which flow stopped.
Did it start after a deploy? What changed? on the app’s alarm screen lists the deploys and configuration changes from the hour before the alarm fired.
About the app → · Download on the App Store