 CloudConsole
aws cloudwatch get-metric-data
aws cloudwatch get-metric-data --metric-data-queries file://queries.json --start-time ... --end-time ... retrieves several metrics in one call, and can compute metric math expressions such as error rates or run SEARCH expressions across many resources. Results come back as parallel Timestamps and Values arrays per query ID, newest first by default.
What the command does
Each entry in --metric-data-queries is either a MetricStat (a metric with period and statistic) or an Expression (metric math, or a SEARCH). Queries have an Id so expressions can refer to them, and ReturnData controls whether a query appears in the output. The response has MetricDataResults[] with Id, Label, Timestamps, Values and a StatusCode of Complete or PartialData.
Syntax
aws cloudwatch get-metric-data \
  --metric-data-queries file://queries.json \
  --start-time 2026-11-16T00:00:00Z --end-time 2026-11-16T06:00:00Z \
  [--scan-by TimestampAscending|TimestampDescending] \
  [--max-datapoints 1000]
Worked examples
Lambda error rate, with only the computed series returned. queries.json:
[
  { "Id": "errors", "ReturnData": false,
    "MetricStat": { "Metric": { "Namespace": "AWS/Lambda", "MetricName": "Errors",
      "Dimensions": [{ "Name": "FunctionName", "Value": "checkout" }] }, "Period": 300, "Stat": "Sum" } },
  { "Id": "invocations", "ReturnData": false,
    "MetricStat": { "Metric": { "Namespace": "AWS/Lambda", "MetricName": "Invocations",
      "Dimensions": [{ "Name": "FunctionName", "Value": "checkout" }] }, "Period": 300, "Stat": "Sum" } },
  { "Id": "rate", "Expression": "IF(invocations > 0, 100 * errors / invocations, 0)", "Label": "Error %" }
]
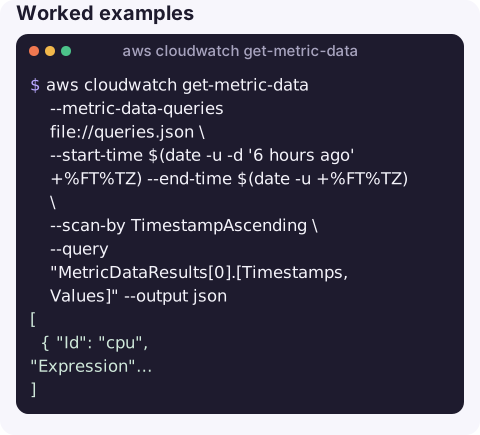
aws cloudwatch get-metric-data --metric-data-queries file://queries.json \
--start-time $(date -u -d '6 hours ago' +%FT%TZ) --end-time $(date -u +%FT%TZ) \
--scan-by TimestampAscending \
--query "MetricDataResults[0].[Timestamps,Values]" --output jsonCPU of every EC2 instance at once with a search expression. Put it in search.json, because the nested quotes are painful to get right inline:
[
  { "Id": "cpu",
    "Expression": "SEARCH('{AWS/EC2,InstanceId} MetricName=\"CPUUtilization\"', 'Average', 300)" }
]
aws cloudwatch get-metric-data --metric-data-queries file://search.json \
--start-time $(date -u -d '1 hour ago' +%FT%TZ) --end-time $(date -u +%FT%TZ) \
--query "MetricDataResults[].[Label, max(Values)]" --output textEach matching instance becomes its own result, labelled with its instance ID, so this prints the peak CPU of every instance in the last hour.
Pair timestamps with values for reading:
aws cloudwatch get-metric-data --metric-data-queries file://queries.json \
  --start-time 2026-11-16T00:00:00Z --end-time 2026-11-16T06:00:00Z --output json \
  | jq -r '.MetricDataResults[0] | [.Timestamps, .Values] | transpose[] | @tsv'
Compared with get-metric-statistics
| get-metric-data | get-metric-statistics | |
|---|---|---|
| Metrics per call | Up to 500 queries | One |
| Metric math and SEARCH | Yes | No |
| Large ranges | Paginates with NextToken | 1,440 datapoints maximum |
| Output order | Sorted (newest first by default) | Unsorted |
| Output shape | Parallel arrays per query | List of datapoint objects |
Gotchas
- Ids must start with a lower-case letter and may contain only letters, numbers and underscores.
PartialDatameans there is more to fetch; the CLI followsNextTokenfor you, but scripts using the SDK must loop.- Newest first. Pass
--scan-by TimestampAscendingfor chronological arrays. - Billing. Unlike many read APIs, this one is charged by the number of metrics requested, so dashboards or scripts polling hundreds of metrics every minute add up.
- Empty results for a
MetricStatusually mean a dimension mismatch; check withlist-metrics.
Questions
How do I use get-metric-data with metric math?
Define the input metrics with ReturnData false, then add a query with an Expression that refers to their Ids, such as 100 * errors / invocations.
Why are get-metric-data results in reverse order?
The default ordering is TimestampDescending. Pass --scan-by TimestampAscending to get oldest first.
Is get-metric-data more expensive than get-metric-statistics?
get-metric-data is billed per metric requested. For an occasional single-metric lookup either is fine; for bulk retrieval get-metric-data needs far fewer calls.
Error rates rather than raw counts are usually what you want to see when deciding whether to act. CloudConsole, a phone app for AWS, is built to show metrics and alarms in a form that reads well on a phone.
About the app → · Download on the App Store