 CloudConsole
API Gateway IntegrationLatency alarm per route (WebSocket API)
This alarm watches backend response time for one WebSocket route using the ApiId, Stage and Route dimensions, firing when p90 IntegrationLatency is at or above 2,000 ms for 5 of 5 one-minute periods. It needs detailed metrics on the stage and is worth it when routes call different backends.
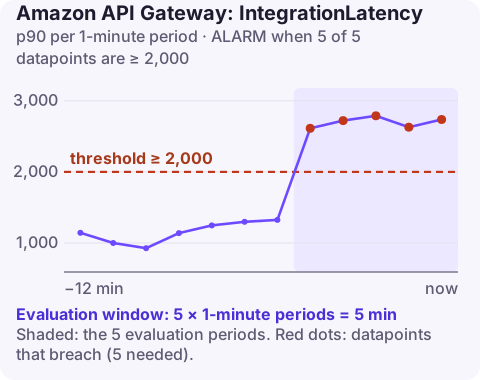
When to go per route
The stage-level IntegrationLatency alarm takes the p90 across every message that reached an integration. On a WebSocket API that usually means a mix of fast routes (heartbeats, presence) and slower ones (saving state, calling a payment service). Fast routes dominate the count and can hide a slow one.
Use the per-route alarm when:
- routes map to different Lambda functions or services, so one can degrade alone;
- some routes need much tighter limits than others;
- you want the alarm itself to name the failing route, instead of digging after it fires.
Recommended settings
| Setting | Value |
|---|---|
| Namespace | AWS/ApiGateway |
| Metric | IntegrationLatency |
| Dimensions | ApiId, Stage, Route |
| Statistic | p90 |
| Period | 60 seconds |
| Datapoints to alarm | 5 |
| Evaluation periods | 5 |
| Comparison operator | GreaterThanOrEqualToThreshold |
| Threshold | 2000.0 (milliseconds) |
Settings as given in the CloudWatch recommended alarms list. The Route value is the route key, such as saveDocument or $connect.
Choosing a threshold per route
- Enable detailed metrics and let a week of data build up.
- For each route, find its typical p90 and its worst healthy p90.
- Ask what delay a user notices for that action. A typing indicator that lags by a second feels broken; a document save taking two seconds may be fine.
- Set the threshold between the worst healthy value and that user limit.
Routes with few messages per minute produce unreliable percentiles; either lengthen the period or add --evaluate-low-sample-count-percentile ignore.
Create it
aws apigatewayv2 update-stage --api-id w1x2y3z4a5 --stage-name prod \
  --default-route-settings DetailedMetricsEnabled=true
aws cloudwatch put-metric-alarm \
--alarm-name docs-ws-savedocument-p90 \
--namespace AWS/ApiGateway \
--metric-name IntegrationLatency \
--dimensions Name=ApiId,Value=w1x2y3z4a5 Name=Stage,Value=prod Name=Route,Value=saveDocument \
--extended-statistic p90 \
--period 60 \
--evaluation-periods 5 \
--datapoints-to-alarm 5 \
--threshold 2000 \
--comparison-operator GreaterThanOrEqualToThreshold \
--treat-missing-data notBreaching \
--alarm-actions arn:aws:sns:eu-west-2:123456789012:ops-alerts \
--region eu-west-2When it fires
- Identify the integration behind the route with
aws apigatewayv2 get-routes --api-id w1x2y3z4a5and the target it lists. - Compare with the backend metric. For a Lambda function, chart its
Durationp90; matching curves mean the function is slow, a large gap suggests cold starts or throttling. - Check the
$connectroute separately. Slow connects are often an authorizer or a database lookup on connect, and they delay every client reconnecting after a deploy. - Look for integration errors on the same route; timeouts often appear as both high latency and errors.
- Consider the payload. A route whose messages suddenly carry much larger documents takes longer to process; check whether a client change increased message size.
If the route's backend is shared with other routes, expect their alarms to follow shortly; fixing the shared dependency clears them together.
Questions
How do I monitor latency for a specific WebSocket route?
Enable detailed metrics on the stage, then alarm on IntegrationLatency with the ApiId, Stage and Route dimensions.
Does IntegrationLatency exist for the $connect route?
Yes, when $connect has an integration. Slow connects are worth alarming on separately because they affect every reconnecting client.
Why 2,000 ms?
It is AWS's starting point. Most interactive WebSocket routes should use a lower value based on their own history.
When one real-time feature lags, users notice before dashboards do. CloudConsole, a phone app for AWS, is built to show per-route alarms like this one with the backend's timings on a phone.
Did it start after a deploy? What changed? on the app’s alarm screen lists the deploys and configuration changes from the hour before the alarm fired.
About the app → · Download on the App Store