 CloudConsole
CloudWatch alarm: Lambda Duration (p90)
Alarm on AWS/Lambda Duration per FunctionName using the p90 extended statistic over 60 seconds, firing when it stays above your threshold for 15 of 15 minutes. Set the threshold above normal p90 but clearly below the function's configured timeout, so you hear about slowdowns before they turn into timeouts.
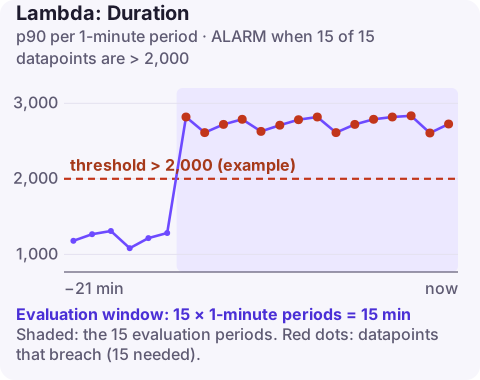
What Duration measures
Duration is the time your handler runs for each invocation, in milliseconds, from when the handler starts to when it returns or fails. Using p90 means the alarm tracks the slowest tenth of invocations, which reacts to real slowdowns without being dominated by one outlier as Maximum would be.
Longer duration costs you three ways: you pay for more compute time, each invocation holds concurrency longer (so a slowdown can trigger throttling), and invocations approaching the timeout start failing as timeouts. The usual triggers are a slower dependency (database, third-party API), a code change, growing payload sizes, and cold starts in functions with heavy initialisation.
Watch out for functions that serve very different request types (a small lookup and a large export in the same handler). Their p90 shifts with the mix of requests rather than with performance, which makes a single threshold unreliable; splitting them into separate functions makes the alarm meaningful.
Recommended alarm settings
| Setting | Recommended value |
|---|---|
| Namespace | AWS/Lambda |
| Metric | Duration |
| Dimensions | FunctionName |
| Statistic | p90 |
| Threshold | Depends on your situation (see the method below) |
| Period | 60 seconds |
| Datapoints to alarm | 15 |
| Evaluation periods | 15 |
| Comparison operator | GreaterThanThreshold |
Choosing the threshold
- Find the ceiling: the configured timeout. Read it with
aws lambda get-function-configuration --function-name report-builder --query Timeout(seconds). - Find normal: chart p90 for two weeks at one-minute resolution and note its typical peak.
- Set the threshold between them, commonly 1.5 to 2 times normal p90, and no more than about 80% of the timeout. For a function with a normal p90 of 800 ms and a 10-second timeout, 2,000 ms is a reasonable start.
- For latency SLOs, use the SLO target instead, as long as it is below the timeout.
The 15-minute window keeps cold-start bursts after a deploy from paging you. Percentiles need enough samples; for functions with only a few invocations a minute, p90 is noisy, so consider a longer period.
Create the alarm
aws cloudwatch put-metric-alarm \
  --alarm-name lambda-report-builder-duration-p90 \
  --alarm-description "report-builder p90 duration above 2s for 15 minutes" \
  --namespace AWS/Lambda \
  --metric-name Duration \
  --dimensions Name=FunctionName,Value=report-builder \
  --extended-statistic p90 \
  --period 60 \
  --evaluation-periods 15 \
  --datapoints-to-alarm 15 \
  --threshold 2000 \
  --comparison-operator GreaterThanThreshold \
  --treat-missing-data notBreaching \
  --alarm-actions arn:aws:sns:eu-west-2:123456789012:oncall-alerts
Percentile alarms use --extended-statistic instead of --statistic; the two cannot be combined.
When it fires
- Find the slow invocations with a Logs Insights duration query, and check whether they are cold starts (
Init Durationpresent in the REPORT line). - Check dependencies: database latency, API response times, and whether timeouts on your HTTP and SDK clients are set.
- Check for a deploy or configuration change around the start time; roll back if needed.
- Consider memory: CPU scales with memory, so CPU-bound code often speeds up at a higher setting.
Questions
How do I set a CloudWatch alarm for Lambda timeouts?
Alarm on Duration with a threshold below the timeout to get early warning, and on Errors to catch the timeouts themselves.
Why use p90 rather than Average for Lambda Duration?
Averages hide the slow tail that users and timeouts care about. p90 moves when a meaningful share of invocations slows down.
What unit is Lambda Duration in?
Milliseconds. Set the threshold in milliseconds, while the function timeout is configured in seconds.
A slow function rarely needs a 3am fix, but you do want to know whether it is getting worse. CloudConsole, a phone app for AWS, is built to show duration alarms and the slow invocations behind them on your phone.
Did it start after a deploy? What changed? on the app’s alarm screen lists the deploys and configuration changes from the hour before the alarm fired.
About the app → · Download on the App Store