 CloudConsole
CloudWatch alarm for CloudFront FunctionThrottles
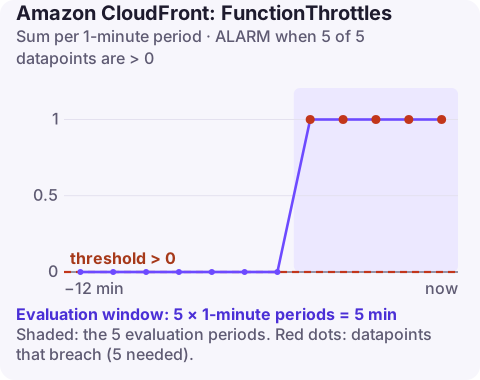
FunctionThrottles counts invocations CloudFront stopped because the function used more than its allowed compute time. AWS recommends alarming when the Sum is above 0 for 5 of 5 one-minute periods per DistributionId and FunctionName (Region=Global, us-east-1). The fix is almost always faster code, not a quota increase.
What throttling means for CloudFront Functions
Throttling here is not about request rate. CloudFront Functions get a very small, fixed compute budget per invocation, and a function that exceeds it is cut off. The companion metric FunctionComputeUtilization reports how much of that budget each invocation used, as a percentage. A function that normally sits at 20–30% will never throttle; one that hovers near 100% throttles whenever a slightly larger input comes along.
Common reasons a function gets close to the limit:
- looping over large inputs, such as every cookie or query parameter, with string work inside the loop;
- building regular expressions inside the handler, or using expensive patterns, on every request;
- large lookup tables (redirect maps) searched linearly instead of with an object key lookup;
- adding logic over time to a function that was written for one simple rewrite.
Recommended alarm settings
| Setting | Value |
|---|---|
| Namespace | AWS/CloudFront |
| Metric | FunctionThrottles |
| Dimensions | DistributionId, FunctionName, Region=Global |
| Statistic | Sum |
| Period | 60 seconds |
| Datapoints to alarm | 5 |
| Evaluation periods | 5 |
| Comparison operator | GreaterThanThreshold |
| Threshold | 0.0 |
As listed on AWS's recommended alarms page. Zero is the target because every throttled invocation is a viewer request that did not get the behaviour you designed.
Create it
aws cloudwatch put-metric-alarm \
  --alarm-name cdn-url-rewrite-throttles \
  --namespace AWS/CloudFront \
  --metric-name FunctionThrottles \
  --dimensions Name=DistributionId,Value=E1A2B3C4D5E6F7 Name=FunctionName,Value=url-rewrite Name=Region,Value=Global \
  --statistic Sum \
  --period 60 \
  --evaluation-periods 5 \
  --datapoints-to-alarm 5 \
  --threshold 0 \
  --comparison-operator GreaterThanThreshold \
  --treat-missing-data notBreaching \
  --alarm-actions arn:aws:sns:us-east-1:123456789012:ops-alerts \
  --region us-east-1
Add an early-warning alarm on FunctionComputeUtilization (Maximum, above about 70%) so you hear about creeping cost before any request is throttled.
Tuning
The threshold should stay at zero. What you can tune is the window: throttles that come and go with input size may not breach five minutes in a row, so look at the Sum over a day as well. If you see a few throttles daily, treat that as a bug to fix, not noise to filter.
When it fires
- Measure the function with test-function, which reports
ComputeUtilizationfor a sample event. Try your largest realistic request (many cookies, long query strings):aws cloudfront test-function --name url-rewrite --if-match ETVPDKIKX0DER \ --stage LIVE --event-object fileb://big-request.json \ --query "TestResult.ComputeUtilization" - Optimise the hot path: hoist regular expressions and constant tables out of the handler, use object key lookups for redirect maps, and return early for requests the function does not need to touch.
- Move heavy logic elsewhere. Large redirect sets fit better in CloudFront KeyValueStore lookups or at the origin; anything needing network calls or real computation belongs in Lambda@Edge.
- Publish the faster version and watch
FunctionComputeUtilizationdrop.
Questions
Why is my CloudFront function being throttled?
It is using more than the compute time CloudFront allows per invocation. Check FunctionComputeUtilization; values near 100% mean the code needs to be faster.
Can I request a higher limit for CloudFront Functions?
The per-invocation compute budget is designed to be small. If a function needs more, move the work to Lambda@Edge or the origin.
What metric warns before throttling starts?
FunctionComputeUtilization. Alarm on its Maximum at around 70% to catch growth before requests are cut off.
Function throttles tend to appear after someone grows a redirect list or adds a feature, not at a predictable time. CloudConsole, a phone app for AWS, is built to show this alarm and the compute-utilisation trend on a phone.
Did it start after a deploy? What changed? on the app’s alarm screen lists the deploys and configuration changes from the hour before the alarm fired.
About the app → · Download on the App Store