 CloudConsole
CloudWatch alarm for CloudFront OriginLatency
Alarm on the p90 of OriginLatency for the distribution (DistributionId, Region=Global) when it is above roughly 80% of your origin response timeout for 5 of 5 one-minute periods. With the default 30-second timeout that is 24,000 ms. The metric only exists once additional metrics are enabled.
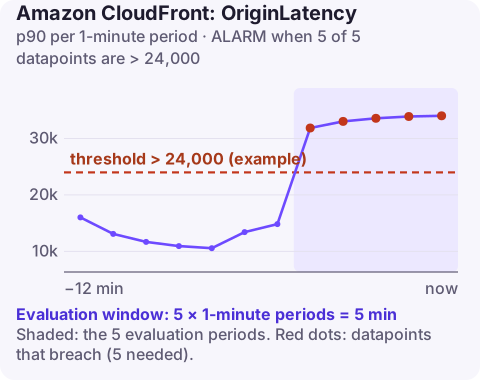
What OriginLatency measures
OriginLatency is the time, in milliseconds, between CloudFront receiving a viewer request and starting to send the response, counted only for requests CloudFront had to fetch from the origin. Cache hits are excluded, so a well-cached site can look fast to users while this metric shows the origin struggling.
It is one of the additional metrics, which you turn on per distribution and pay for monthly. It is not in the free default set.
Because it is a percentile alarm, it describes the slow end of origin fetches. A healthy origin behind a busy distribution typically shows a p90 in the low hundreds of milliseconds; numbers in whole seconds mean viewers who miss the cache are waiting noticeably, even if nothing is failing yet.
Recommended alarm settings
| Setting | Value |
|---|---|
| Namespace | AWS/CloudFront |
| Metric | OriginLatency |
| Dimensions | DistributionId, Region=Global |
| Statistic | p90 |
| Period | 60 seconds |
| Datapoints to alarm | 5 |
| Evaluation periods | 5 |
| Comparison operator | GreaterThanThreshold |
| Threshold | Depends on your situation: about 80% of the origin response timeout |
Settings from AWS's recommended alarms list. Like all CloudFront metrics, it is published in us-east-1 with the extra dimension Region=Global.
Working out the threshold
CloudFront gives up on an origin that has not responded within the origin's response timeout and returns a 504 to the viewer. AWS's rule of thumb is to alarm at about 80% of that value, so you hear about it while requests are still succeeding.
| Origin response timeout | 80% threshold (ms) |
|---|---|
| 30 s (default) | 24000 |
| 10 s | 8000 |
| 60 s | 48000 |
Check the configured value with aws cloudfront get-distribution-config --id E1A2B3C4D5E6F7 --query "DistributionConfig.Origins.Items[].[Id,CustomOriginConfig.OriginReadTimeout]". For interactive sites, also consider a second, lower alarm based on your normal p90 (for example, twice the usual value) to catch slowness long before timeouts.
Enable the metric and create the alarm
aws cloudfront create-monitoring-subscription --distribution-id E1A2B3C4D5E6F7 \
  --monitoring-subscription "RealtimeMetricsSubscriptionConfig={RealtimeMetricsSubscriptionStatus=Enabled}"
aws cloudwatch put-metric-alarm \
--alarm-name cdn-www-origin-latency-p90 \
--namespace AWS/CloudFront \
--metric-name OriginLatency \
--dimensions Name=DistributionId,Value=E1A2B3C4D5E6F7 Name=Region,Value=Global \
--extended-statistic p90 \
--period 60 \
--evaluation-periods 5 \
--datapoints-to-alarm 5 \
--threshold 24000 \
--comparison-operator GreaterThanThreshold \
--treat-missing-data notBreaching \
--alarm-actions arn:aws:sns:us-east-1:123456789012:ops-alerts \
--region us-east-1When it fires
- Is the origin itself slow? Check its own latency metrics (load balancer
TargetResponseTime, application p90). If yes, the fix is there: scaling, a slow query, a struggling dependency. - Did the cache hit rate fall? An invalidation of everything, a new query string or header in the cache key, or a cache policy change sends far more traffic to the origin and slows it.
- Is one path slow? Real-time logs or standard logs with
time-to-first-byteshow which URIs are slow. - AWS's guide to delayed responses from the origin application lists further fixes. Raising the response timeout hides the symptom; use it only for endpoints that are legitimately slow.
Questions
Why is OriginLatency not showing in CloudWatch?
It is an additional metric. Enable additional metrics for the distribution (a monthly charge applies) and look in us-east-1.
What is the default CloudFront origin response timeout?
30 seconds for custom origins, adjustable per origin. At 80%, that gives a threshold of 24,000 ms.
Does OriginLatency include cache hits?
No. It only covers requests that CloudFront forwarded to the origin.
Origin slowness often starts after a cache change made by someone else. CloudConsole, a phone app for AWS, is built to show the alarm with the cache hit rate and error rate side by side on a phone.
Did it start after a deploy? What changed? on the app’s alarm screen lists the deploys and configuration changes from the hour before the alarm fired.
About the app → · Download on the App Store