 CloudConsole
CloudWatch alarm for CloudFront 5xxErrorRate
5xxErrorRate is the percentage of a distribution's viewer requests that got a 5xx status. AWS recommends alarming on its Average for the DistributionId with Region=Global when it is above a threshold you choose for 5 of 5 one-minute periods; the alarm must be created in us-east-1.
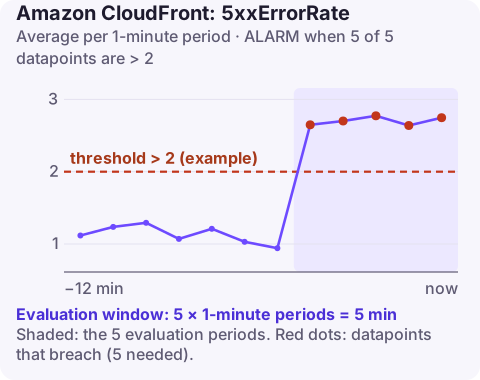
What the metric includes
5xxErrorRate is a percentage (0–100) of all requests to the distribution that ended in a 500-range response. Those responses come from two places:
- Your origin returned a 5xx and CloudFront passed it on.
- CloudFront generated it because it could not get a usable answer from the origin: 502 when it cannot connect or negotiate TLS, 504 when the origin did not respond within the origin response timeout, 503 when the origin or an edge function is overloaded.
The free default metrics give you the rate only. Turning on additional metrics (charged per distribution) splits it into 502, 503 and 504 rates and adds origin latency and cache hit rate.
Recommended alarm settings
| Setting | Value |
|---|---|
| Namespace | AWS/CloudFront |
| Metric | 5xxErrorRate |
| Dimensions | DistributionId, Region=Global |
| Statistic | Average |
| Period | 60 seconds |
| Datapoints to alarm | 5 |
| Evaluation periods | 5 |
| Comparison operator | GreaterThanThreshold |
| Threshold | Depends on your situation: choose from history; keep it above 0 |
As given in the CloudWatch recommended alarms list. CloudFront publishes its metrics in US East (N. Virginia), and every metric carries Region=Global as a second dimension; leave it out and the alarm never finds data.
Choosing a threshold
AWS asks for a value above zero because brief origin hiccups are normal at scale. A method that works:
- Graph
5xxErrorRate(Average, one minute) for 14 days inus-east-1. - Ignore minutes that belong to known incidents and note the highest remaining value.
- Set the threshold a little above that, with a floor of around 1% for busy sites.
Low-traffic distributions swing wildly in percentage terms; there, a threshold of 5–10% or a longer period avoids paging on two failed requests. Treat missing data as notBreaching.
Create it
# Threshold 2 (= 2% of requests) is an example
aws cloudwatch put-metric-alarm \
  --alarm-name cdn-www-5xx-rate \
  --namespace AWS/CloudFront \
  --metric-name 5xxErrorRate \
  --dimensions Name=DistributionId,Value=E1A2B3C4D5E6F7 Name=Region,Value=Global \
  --statistic Average \
  --period 60 \
  --evaluation-periods 5 \
  --datapoints-to-alarm 5 \
  --threshold 2 \
  --comparison-operator GreaterThanThreshold \
  --treat-missing-data notBreaching \
  --alarm-actions arn:aws:sns:us-east-1:123456789012:ops-alerts \
  --region us-east-1
When it fires
- Request the site directly at the origin (bypassing CloudFront). If it fails there too, it is the origin's problem; follow its own alarms.
- If the origin is fine, check what CloudFront sees: in standard or real-time logs, the
x-edge-detailed-result-typefield names connection, DNS and timeout failures to the origin. - 502s: usually TLS between CloudFront and the origin: an expired or mismatched origin certificate, or the origin protocol policy pointing HTTPS at an HTTP-only port.
- 504s: the origin is slow; see the OriginLatency alarm and AWS's guide to origin error responses.
- 503s with functions attached: check the function error and throttle metrics.
Questions
Why can't I see CloudFront metrics in my Region?
CloudFront is a global service and publishes its metrics in us-east-1 only. Switch the console or CLI to us-east-1.
Is 5xxErrorRate a percentage or a count?
A percentage of all requests, from 0 to 100. A threshold of 2 means 2% of requests.
How do I see 502 vs 504 rates separately?
Enable additional metrics for the distribution. It adds 502, 503 and 504 error rates, at an extra monthly cost.
A CDN error spike is usually visible to every user at once, so speed of triage matters. CloudConsole, a phone app for AWS, is built to show the alarm and the distribution's error breakdown on a phone.
Did it start after a deploy? What changed? on the app’s alarm screen lists the deploys and configuration changes from the hour before the alarm fired.
About the app → · Download on the App Store