 CloudConsole
CloudWatch alarm for DynamoDB AccountProvisionedReadCapacityUtilization
This account-level metric shows what percentage of the Region's read capacity quota your provisioned tables and indexes are using. AWS recommends alarming when its Maximum is above 80 in 2 of 2 five-minute periods, so you can raise the quota before auto scaling runs out of room and reads start to throttle.
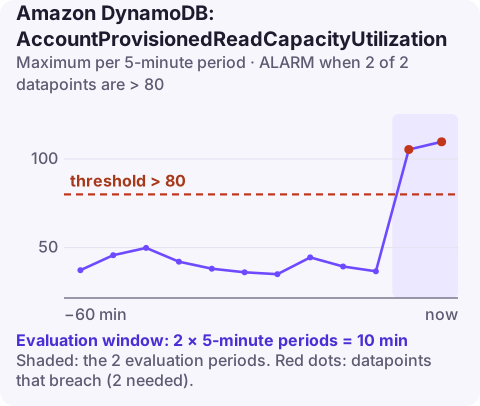
What the metric actually tracks
DynamoDB caps how many read capacity units (RCUs) an account can provision in one Region, summed across every provisioned-mode table and global secondary index. AccountProvisionedReadCapacityUtilization is that sum as a percentage of the cap. It has no dimensions: one value per account per Region.
The failure mode is indirect. Nothing slows down when you cross 80%. The trouble starts when traffic grows and auto scaling tries to raise a table's read capacity but cannot, because the account has no headroom left. The table stays at its old capacity, and the reads that do not fit are throttled. That usually happens at peak, which is the worst time to find out.
Recommended alarm settings
| Setting | Value |
|---|---|
| Namespace | AWS/DynamoDB |
| Metric | AccountProvisionedReadCapacityUtilization |
| Dimensions | none (account and Region level) |
| Statistic | Maximum |
| Period | 300 seconds |
| Datapoints to alarm | 2 |
| Evaluation periods | 2 |
| Comparison operator | GreaterThanThreshold |
| Threshold | 80.0 (percent) |
Settings as published on the CloudWatch recommended alarms page. The five-minute period and Maximum statistic match a metric that changes only when capacity settings change.
Tuning
80% is a sensible default for most accounts. Lower it if:
- you have tables whose auto scaling maximums, added together, exceed the account quota (they can all scale up during the same event);
- a quota increase takes you days to get approved and you need more lead time;
- you are about to create new provisioned tables, such as per-tenant tables or a new environment, in the same account and Region.
Check the current quota and per-table limits directly:
aws dynamodb describe-limits --region eu-west-2Create it
aws cloudwatch put-metric-alarm \
  --alarm-name ddb-account-read-capacity-80pct \
  --namespace AWS/DynamoDB \
  --metric-name AccountProvisionedReadCapacityUtilization \
  --statistic Maximum \
  --period 300 \
  --evaluation-periods 2 \
  --datapoints-to-alarm 2 \
  --threshold 80 \
  --comparison-operator GreaterThanThreshold \
  --alarm-actions arn:aws:sns:eu-west-2:123456789012:ops-alerts \
  --region eu-west-2
Create one alarm in each Region where you run provisioned DynamoDB tables; the metric is regional.
When it fires
- Find where the capacity has gone. List tables and their provisioned read capacity, including indexes:
for t in $(aws dynamodb list-tables --query "TableNames[]" --output text); do aws dynamodb describe-table --table-name "$t" \ --query "[Table.TableName, Table.ProvisionedThroughput.ReadCapacityUnits, Table.GlobalSecondaryIndexes[].ProvisionedThroughput.ReadCapacityUnits]" \ --output text done - Reclaim waste. Old test tables, over-provisioned indexes and auto scaling minimums set far above real use all count against the quota.
- Consider on-demand for spiky tables, which removes the need to provision capacity for their peaks.
- Request a quota increase for account-level read capacity through Service Quotas if the usage is legitimate.
Once headroom is back, check that auto scaling on the busiest tables has caught up; it does not retry instantly, and throttling can linger for a few minutes after the quota is raised.
Questions
What is AccountProvisionedReadCapacityUtilization?
The percentage of the account's regional read capacity quota currently provisioned across your provisioned-mode DynamoDB tables and indexes.
Does hitting the account read quota throttle requests immediately?
Not directly. It stops you raising capacity further, so tables that need to scale up stay where they are and their excess reads are throttled.
How do I see my DynamoDB account limits?
Run aws dynamodb describe-limits in the Region, or look up DynamoDB in the Service Quotas console.
Running out of account capacity tends to surface during a traffic peak. CloudConsole, a phone app for AWS, is built to show account-level alarms like this one alongside the tables using the most capacity.
Did it start after a deploy? What changed? on the app’s alarm screen lists the deploys and configuration changes from the hour before the alarm fired.
About the app → · Download on the App Store