 CloudConsole
CloudWatch alarm for DynamoDB ReadThrottleEvents (table)
ReadThrottleEvents counts read requests DynamoDB rejected because they exceeded the table's capacity or a partition's limit. AWS recommends alarming on its Sum per TableName when it is above a threshold you set for 5 of 5 one-minute periods; set it above the level of throttling your retries absorb, so it catches sustained throttling.
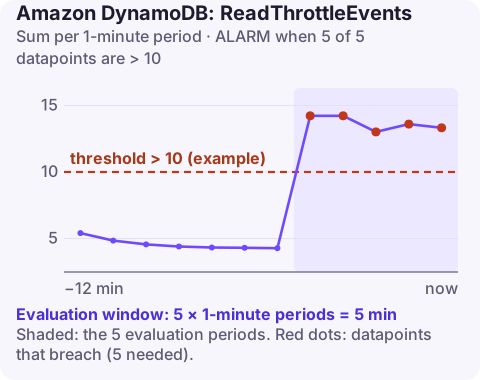
What makes reads throttle
A throttled read fails with ProvisionedThroughputExceededException (or a throttling error on on-demand tables), the SDK retries it with backoff, and the caller sees extra latency or, if retries run out, an error. The usual reasons, most common first:
| Cause | Clue |
|---|---|
| Provisioned read capacity too low, or auto scaling too slow for a sudden spike | ConsumedReadCapacityUnits pinned at the provisioned line |
| Hot partition: many reads on one key or a narrow key range | Throttling while consumed capacity is well below provisioned |
Expensive reads: Scan, large items, strongly consistent reads (twice the cost of eventually consistent) | Throttles coincide with a batch job or report |
| On-demand table hit with a sudden jump far above its previous peak, or a configured maximum throughput | Throttling on a table you thought could not throttle |
Each partition serves at most 3,000 read capacity units per second, however much you provision for the table.
Recommended alarm settings
| Setting | Value |
|---|---|
| Namespace | AWS/DynamoDB |
| Metric | ReadThrottleEvents |
| Dimensions | TableName |
| Statistic | Sum |
| Period | 60 seconds |
| Datapoints to alarm | 5 |
| Evaluation periods | 5 |
| Comparison operator | GreaterThanThreshold |
| Threshold | Depends on your situation: above your normal, retried level of throttling |
From the CloudWatch recommended alarms page. Index reads are counted separately; see ReadThrottleEvents for a GSI.
Picking the threshold
- Graph
ReadThrottleEvents(Sum) andConsumedReadCapacityUnits(Sum) at one-minute resolution for the last two weeks. - If throttling is zero almost all the time, use a small number such as 5 or 10 so the alarm fires only when it persists for five minutes.
- If you see brief bursts every day that the application rides out, set the threshold above the typical burst minute.
- If throttling is steady all day, do not tune it away: the table needs more capacity or a better key design.
Treat missing data as notBreaching; no events are published in minutes with no throttling.
Create it
# 10 throttled reads/minute is an example threshold
aws cloudwatch put-metric-alarm \
  --alarm-name orders-read-throttles \
  --namespace AWS/DynamoDB \
  --metric-name ReadThrottleEvents \
  --dimensions Name=TableName,Value=orders \
  --statistic Sum \
  --period 60 \
  --evaluation-periods 5 \
  --datapoints-to-alarm 5 \
  --threshold 10 \
  --comparison-operator GreaterThanThreshold \
  --treat-missing-data notBreaching \
  --alarm-actions arn:aws:sns:eu-west-2:123456789012:ops-alerts \
  --region eu-west-2
When it fires
- Capacity or key? If consumed reads hit the provisioned line, raise capacity (or the auto scaling maximum). If they did not, you have a hot key; turn on CloudWatch Contributor Insights to see the most-throttled keys:
aws dynamodb update-contributor-insights --table-name orders \ --contributor-insights-action ENABLE - Find the expensive caller. A new
Scan-based report or an export job is a frequent trigger; paginate it with a smallerLimitand pace it. - Cache hot items in DynamoDB Accelerator (DAX) or your own cache when one item is read thousands of times a second.
- Use eventually consistent reads where the application allows; they cost half as much.
- AWS's throttling troubleshooting guide and ProvisionedThroughputExceededException cover the details.
Questions
Can an on-demand DynamoDB table throttle reads?
Yes. Sudden traffic far above the table's previous peak, a hot partition, or a maximum throughput you configured can all throttle an on-demand table.
Does ReadThrottleEvents include GSI reads?
Reads against a global secondary index are reported under the index, with the GlobalSecondaryIndexName dimension. Alarm on those separately.
Should the threshold be zero?
Usually not. SDKs retry throttled reads, so occasional throttling is invisible to users; alarm on sustained throttling instead.
Read throttling shows up to users as a slow app well before anything errors. CloudConsole, a phone app for AWS, is built to show this alarm with consumed versus provisioned capacity on a phone so you can tell capacity from hot keys.
Did it start after a deploy? What changed? on the app’s alarm screen lists the deploys and configuration changes from the hour before the alarm fired.
About the app → · Download on the App Store