 CloudConsole
ProvisionedThroughputExceededException
DynamoDB rejected requests because they needed more read or write capacity than was available, and your SDK ran out of retries. Either the table or a GSI is under-provisioned for the traffic, or traffic is concentrated on a few partition keys (a hot partition). Check the throttle metrics per table and index, then raise capacity, switch to on-demand, or spread the keys.
What the exception means
ProvisionedThroughputExceededException: The level of configured provisioned
throughput for the table was exceeded. Consider increasing your provisioning
level with the UpdateTable API.
AWS SDKs retry throttled requests automatically with backoff, so by the time your code sees this exception the throttling has been sustained for a while. Throttled requests are visible in CloudWatch as ReadThrottleEvents and WriteThrottleEvents, and the overall ThrottledRequests metric. The message says "table" even when the real bottleneck is an index or a single partition, so do not raise table capacity blindly.
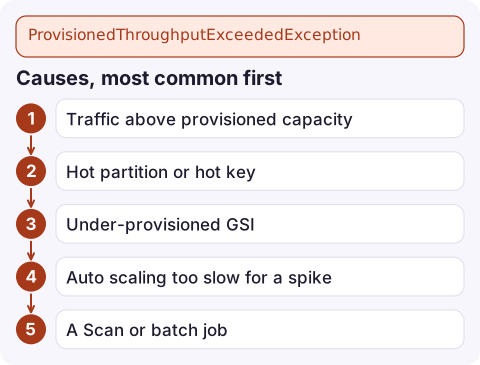
Causes, most common first
| Cause | How to recognise it |
|---|---|
| Traffic above provisioned capacity | ConsumedWriteCapacityUnits sits at the provisioned line before throttles start |
| Hot partition or hot key | Throttling while table-level consumption is well below provisioned |
| Under-provisioned GSI | Throttle metrics on the index dimension; writes to the base table get throttled because the index cannot keep up |
| Auto scaling too slow for a spike | Short, sharp throttling at the start of a burst; capacity catches up minutes later |
| A Scan or batch job | Read throttles coincide with a report, export or migration |
Each partition has its own ceiling (around 3,000 read units and 1,000 write units per second), and that applies on on-demand tables too. On-demand tables can also throttle if traffic jumps far above its previous peak very suddenly, or exceeds a maximum throughput you configured.
Find the bottleneck
Look at the table's capacity mode and every index:
aws dynamodb describe-table --table-name orders \
  --query 'Table.{mode:BillingModeSummary.BillingMode,table:ProvisionedThroughput,gsis:GlobalSecondaryIndexes[].{name:IndexName,pt:ProvisionedThroughput}}'
Check throttling per minute on the table (repeat with a GlobalSecondaryIndexName dimension for each index):
aws cloudwatch get-metric-statistics --namespace AWS/DynamoDB \
  --metric-name WriteThrottleEvents \
  --dimensions Name=TableName,Value=orders \
  --start-time 2026-11-16T08:00:00Z --end-time 2026-11-16T10:00:00Z \
  --period 60 --statistics Sum
If table-level consumption is low but throttling is high, turn on CloudWatch Contributor Insights for the table to see the most-accessed and most-throttled keys:
aws dynamodb update-contributor-insights --table-name orders \
  --contributor-insights-action ENABLE
Fix it
- Raise capacity now on the table or the index that is throttling:
aws dynamodb update-table --table-name orders \ --provisioned-throughput ReadCapacityUnits=200,WriteCapacityUnits=400 - Switch to on-demand for spiky or unpredictable traffic (switching modes is limited in how often you can do it):
aws dynamodb update-table --table-name orders --billing-mode PAY_PER_REQUEST - Fix hot keys: add a random or calculated suffix to the partition key for heavy writers (write sharding), cache hot reads with DAX or an application cache, and avoid partition keys such as a date or a status value.
- Throttle your own batch jobs: rate-limit scans and imports, or run them against an export instead of the live table.
- Retry with jitter: keep the SDK's retries on and add your own backoff for queue consumers so a throttled batch does not retry in lockstep.
Watch for it
Alarm on throttle events rather than on the exception in logs; by the time logs show it, users have seen failures. See WriteThrottleEvents and ReadThrottleEvents. Batch APIs behave differently: BatchWriteItem often returns throttled items in UnprocessedItems instead of raising, so check that field and resend.
Questions
Does on-demand mode eliminate ProvisionedThroughputExceededException?
Mostly, but not entirely. On-demand tables still have per-partition limits and can throttle on a sudden jump far above previous peak traffic or above a maximum throughput you set.
Why am I throttled when consumed capacity is below provisioned?
Usually a hot partition: traffic concentrated on a few partition key values hits a single partition's limit while the table total looks fine. Contributor Insights shows which keys.
Can a GSI throttle writes to the base table?
Yes. If a global secondary index lacks write capacity to absorb updates, DynamoDB throttles writes to the base table that would change that index.

Throttling tends to arrive with a traffic spike, exactly when you are least likely to be at a desk. CloudConsole, a phone app for AWS, is built to show throttle alarms and the table's recent metrics together on your phone, so you can tell a hot key from an undersized table.
Did it start after a deploy? What changed? on the app’s alarm screen lists the deploys and configuration changes from the hour before the alarm fired.
About the app → · Download on the App Store