 CloudConsole
CloudWatch alarm for DynamoDB WriteThrottleEvents (table)
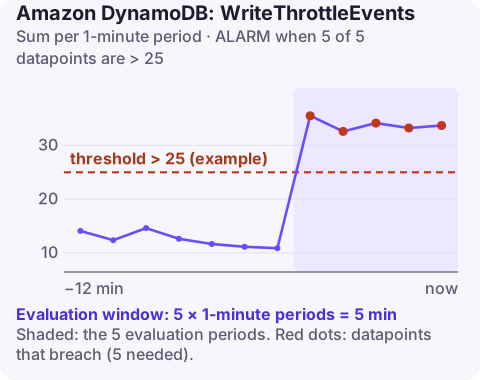
WriteThrottleEvents is the number of writes DynamoDB throttled on a table in each period. AWS recommends an alarm on its Sum per TableName above a threshold you choose, for 5 consecutive one-minute periods, to catch sustained write throttling rather than brief bursts that SDK retries absorb.
Why writes throttle
Write throttling is usually more painful than read throttling: writes often cannot be served from a cache, and a failed write may mean a lost order or event if the caller does not retry correctly. Causes in rough order of frequency:
- Too little provisioned write capacity, or auto scaling reacting too slowly to a sudden surge such as a bulk import.
- A hot partition. Each partition takes at most 1,000 write capacity units per second; time-ordered keys (today's date as the partition key) or a single counter item funnel writes into one partition.
- Large items. A write costs one unit per 1 KB of item size, so a 12 KB item costs 12 units; transactional writes cost twice as much again.
- An under-provisioned global secondary index. If an index cannot keep up, DynamoDB throttles writes to the base table. The table looks fine on paper while writes fail. Check the GSI write throttle metric.
Recommended alarm settings
| Setting | Value |
|---|---|
| Namespace | AWS/DynamoDB |
| Metric | WriteThrottleEvents |
| Dimensions | TableName |
| Statistic | Sum |
| Period | 60 seconds |
| Datapoints to alarm | 5 |
| Evaluation periods | 5 |
| Comparison operator | GreaterThanThreshold |
| Threshold | Depends on your situation: above the retried throttling you consider normal |
As published on the CloudWatch recommended alarms page.
Choosing the threshold
Relate throttles to traffic. Take two weeks of one-minute WriteThrottleEvents alongside ConsumedWriteCapacityUnits. On a table that writes 20,000 units a minute, 50 throttles is a rounding error; on one that writes 500, it is a real problem. A workable rule is to alarm when throttled writes exceed roughly 1% of the normal busy-minute write count, then adjust after a few weeks of real alarms. Bulk jobs that you know will throttle are better paced than excluded. Use notBreaching for missing data.
Create it
# 25 throttled writes/minute is an example; derive yours from traffic
aws cloudwatch put-metric-alarm \
  --alarm-name orders-write-throttles \
  --namespace AWS/DynamoDB \
  --metric-name WriteThrottleEvents \
  --dimensions Name=TableName,Value=orders \
  --statistic Sum \
  --period 60 \
  --evaluation-periods 5 \
  --datapoints-to-alarm 5 \
  --threshold 25 \
  --comparison-operator GreaterThanThreshold \
  --treat-missing-data notBreaching \
  --alarm-actions arn:aws:sns:eu-west-2:123456789012:ops-alerts \
  --region eu-west-2
When it fires
- Check the indexes first. If any GSI shows write throttles, raise that index's capacity; adding table capacity will not help.
- Capacity or key? If consumed writes sit on the provisioned line, raise capacity or the auto scaling maximum. If consumption is well below provisioned, find the hot key with Contributor Insights:
aws dynamodb update-contributor-insights --table-name orders \ --contributor-insights-action ENABLE - Pace bulk writers. Imports and backfills should use a rate limiter, or run against an on-demand table.
- Check retries. Make sure callers retry throttled writes with backoff; for
BatchWriteItem, re-send theUnprocessedItemsit returns (see batch-write-item).
Questions
Why are my DynamoDB writes throttled when consumed capacity is low?
Either one partition is hot, or a global secondary index lacks write capacity and is applying back-pressure to the table.
Does BatchWriteItem throw when items are throttled?
Not always. It can succeed while returning throttled items in UnprocessedItems, which your code must re-send.
How much write capacity does one write use?
One unit per 1 KB of item size, rounded up, and double that for transactional writes.
Write throttling during a busy period can mean lost or delayed business events. CloudConsole, a phone app for AWS, is built to show the alarm with table and index capacity side by side on a phone.
Did it start after a deploy? What changed? on the app’s alarm screen lists the deploys and configuration changes from the hour before the alarm fired.
About the app → · Download on the App Store