 CloudConsole
CloudWatch alarm: Amazon EFS PercentIOLimit
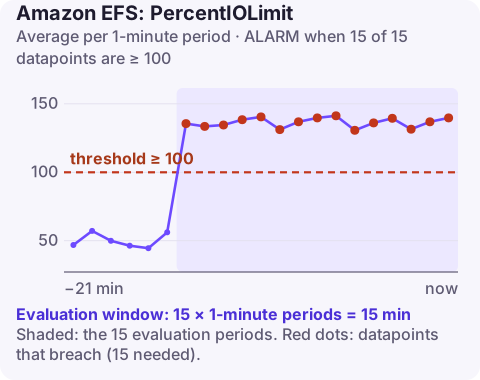
Alarm on AWS/EFS PercentIOLimit per FileSystemId with the Average statistic over 60 seconds, firing when it is at or above 100 for 15 consecutive minutes. Sitting at 100% means a General Purpose file system is at its I/O operations ceiling, so clients see slower reads, writes and metadata calls until load drops.
What PercentIOLimit measures
EFS file systems created in the General Purpose performance mode have a cap on file operations per second. PercentIOLimit shows how close the file system is to that cap. It is only published for General Purpose file systems; a Max I/O file system does not report it.
The cap counts operations, not bytes, and metadata operations count too. That is why the metric often surprises people: a file system moving very little data can still hit 100% if clients are opening, stat-ing and listing thousands of small files. Typical offenders are package installs and build caches on shared storage, PHP or CMS sites with many small includes, session files, and applications that poll a directory for new files.
Recommended alarm settings
| Setting | Recommended value |
|---|---|
| Namespace | AWS/EFS |
| Metric | PercentIOLimit |
| Dimensions | FileSystemId |
| Statistic | Average |
| Threshold | 100.0 |
| Period | 60 seconds |
| Datapoints to alarm | 15 |
| Evaluation periods | 15 |
| Comparison operator | GreaterThanOrEqualToThreshold |
Fifteen of fifteen one-minute datapoints means the alarm ignores short bursts (a deploy copying files, a nightly scan) and only fires when the ceiling has held for a quarter of an hour.
Tuning it for your file system
- Earlier warning. At 100% you are already throttled. If the workload is latency-sensitive, add a second alarm at 80–90% so you can react before users notice.
- Expected batch peaks. If a known job pins the metric for twenty minutes every night, either raise the evaluation window for that file system or suppress the alarm during the job rather than ignoring it entirely.
- Look at it alongside latency. Plot
PercentIOLimitnext to client-side NFS latency (for example fromnfsiostaton a Linux client). If latency does not rise when the metric is high, the alarm can tolerate a longer window.
Create the alarm
aws cloudwatch put-metric-alarm \
  --alarm-name efs-shared-assets-io-limit \
  --alarm-description "EFS fs-0123456789abcdef0 at the General Purpose I/O limit for 15 minutes" \
  --namespace AWS/EFS \
  --metric-name PercentIOLimit \
  --dimensions Name=FileSystemId,Value=fs-0123456789abcdef0 \
  --statistic Average \
  --period 60 \
  --evaluation-periods 15 \
  --datapoints-to-alarm 15 \
  --threshold 100 \
  --comparison-operator GreaterThanOrEqualToThreshold \
  --alarm-actions arn:aws:sns:eu-west-2:123456789012:oncall-alerts
When it fires
- Confirm which clients are busy. Check
ClientConnectionsfor the file system and runnfsiostat 5on the busiest hosts to see operations per second per mount. - Look for metadata storms: recursive
findorls -Rjobs, antivirus or backup agents scanning the mount, or an app checking file existence on every request. - Reduce operations. Cache read-mostly content locally or in a CDN, bundle small files into larger ones, move build and dependency caches to local disk, and stop polling directories.
- Change the architecture if it is structural. The performance mode is fixed when a file system is created. Moving to Max I/O means creating a new file system and copying data, and Max I/O adds per-operation latency, so it is rarely the first fix. Splitting unrelated workloads onto separate file systems often helps more.
Questions
Can I change an EFS file system from General Purpose to Max I/O?
No. Performance mode is chosen at creation. You would need to create a new file system and migrate the data, for example with AWS DataSync.
Does high PercentIOLimit mean I need more throughput?
Not necessarily. This metric is about operations per second; throughput limits are tracked separately by metrics such as PermittedThroughput and BurstCreditBalance.
Why is PercentIOLimit missing for my file system?
It is only published for file systems in General Purpose performance mode. Check the mode with aws efs describe-file-systems.
An EFS I/O ceiling usually shows up as an app that is mysteriously slow rather than broken, which is hard to diagnose on a small screen. CloudConsole, a phone app for AWS, is built to show the alarm and its metric history on your phone so you can decide whether it can wait.
Did it start after a deploy? What changed? on the app’s alarm screen lists the deploys and configuration changes from the hour before the alarm fired.
About the app → · Download on the App Store