 CloudConsole
CloudWatch alarm: ECS Container Insights TaskEBSfilesystemUtilization
Alarm on ECS/ContainerInsights TaskEBSfilesystemUtilization for ClusterName and ServiceName, using the Average over 60-second periods, firing when it is above 80 for 5 out of 5 periods. It warns you that the Amazon EBS volumes attached to a service's tasks are filling up, before writes start failing inside the container.
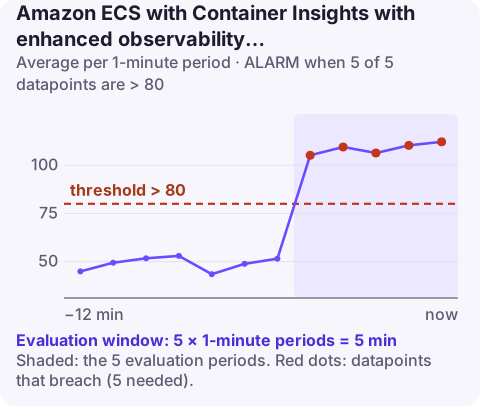
What the metric tells you
ECS can attach an Amazon EBS volume to each task at launch, configured on the service or on run-task. This metric, published by Container Insights with enhanced observability, reports how full the file system on that volume is, as a percentage. With ClusterName and ServiceName, CloudWatch gives you one series per service, averaged over its tasks.
A full volume is not a graceful failure. Applications get "no space left on device" on write, databases and queues running in the task may refuse to start, and log writers can block. Because each task gets its own volume, one task can fill up while the service average still looks comfortable.
Do not confuse this with ephemeral storage. Fargate tasks also have a scratch disk measured by TaskEphemeralStorageUtilization; this metric covers only attached EBS volumes. The older service-level EBSFilesystemUtilization alarm covers the same volumes in the AWS/ECS namespace without needing enhanced observability.
Recommended alarm settings
| Setting | Recommended value |
|---|---|
| Namespace | ECS/ContainerInsights |
| Metric | TaskEBSfilesystemUtilization |
| Dimensions | ClusterName, ServiceName |
| Statistic | Average |
| Threshold | 80.0 |
| Period | 60 seconds |
| Datapoints to alarm | 5 |
| Evaluation periods | 5 |
| Comparison operator | GreaterThanThreshold |
The metric name is reproduced exactly as AWS publishes it in the recommended-alarms list. CloudWatch metric names are case-sensitive, so confirm the spelling your cluster emits before creating the alarm:
aws cloudwatch list-metrics \
  --namespace ECS/ContainerInsights \
  --dimensions Name=ClusterName,Value=prod-cluster \
  --query "Metrics[?contains(MetricName, 'EBS')].MetricName"
Choosing and tuning the threshold
80% is a sensible default because EBS volumes attached by ECS are sized when the task starts; you cannot grow a running task's volume, so the only fix is a new deployment with a larger size. The alarm has to fire while there is still room to deploy.
- Fast-filling workloads (batch jobs writing intermediate files, build agents) can go from 80% to full in minutes. Lower the threshold to 60–70% or shorten the window to 3 of 3.
- Volumes that are mostly read-only data loaded from a snapshot sit at a high, flat level. Set the threshold just above their steady state so only growth triggers it.
- Uneven tasks. If one task can fill independently of the others, add a second alarm with the
Maximumstatistic.
Create it with the CLI
aws cloudwatch put-metric-alarm \
  --alarm-name ecs-prod-ingest-ebs-fs-80 \
  --alarm-description "ingest task EBS volumes above 80% full" \
  --namespace ECS/ContainerInsights \
  --metric-name TaskEBSfilesystemUtilization \
  --dimensions Name=ClusterName,Value=prod-cluster Name=ServiceName,Value=ingest \
  --statistic Average \
  --period 60 \
  --evaluation-periods 5 \
  --datapoints-to-alarm 5 \
  --threshold 80 \
  --comparison-operator GreaterThanThreshold \
  --treat-missing-data notBreaching \
  --alarm-actions arn:aws:sns:eu-west-2:123456789012:oncall-alerts
notBreaching keeps the alarm quiet when the service is scaled to zero. See put-metric-alarm for the full option list.
Runbook when it fires
- Find the full task. Exec into a container and run
df -hon the mount path from the task definition, thenduon its subdirectories. - Look for files that should not be there: temporary output never cleaned up, logs written to the volume instead of stdout, or a cache with no eviction.
- Short-term relief: delete what is safe to delete, or replace the task; a new task gets a fresh volume unless it is created from a snapshot that is itself full.
- Permanent fix: raise
sizeInGiBin the service's volume configuration and roll out with update-service, and add cleanup to the application.
Questions
How do I get CloudWatch alarms for ECS task failures?
Disk-full errors usually surface as tasks crashing and restarting. Pair this alarm with one on RunningTaskCount, and check stopped-task reasons with describe-tasks to see whether storage caused the exit.
Can I resize the EBS volume of a running ECS task?
No. The volume size is part of the configuration used when the task launches. Change the size in the service configuration and deploy, which replaces the tasks.
Do I need enhanced observability for this metric?
Yes, the ECS/ContainerInsights task-level EBS metric is part of enhanced observability. Without it, use EBSFilesystemUtilization in the AWS/ECS namespace instead.
A disk that fills on one task tends to show up first as crash loops, often at an awkward hour. CloudConsole is a phone app for AWS, built so you can see the storage alarm and the service's stopped tasks together from your phone.
Did it start after a deploy? What changed? on the app’s alarm screen lists the deploys and configuration changes from the hour before the alarm fired.
About the app → · Download on the App Store