 CloudConsole
CloudWatch alarm: EKS node_cpu_utilization
Alarm on ContainerInsights node_cpu_utilization per ClusterName using the Maximum over 60 seconds, firing when it is above 80 for 5 of 5 minutes. It tells you worker nodes in the cluster have been running above 80% CPU for five minutes, early enough to add capacity or move load before pods slow down.
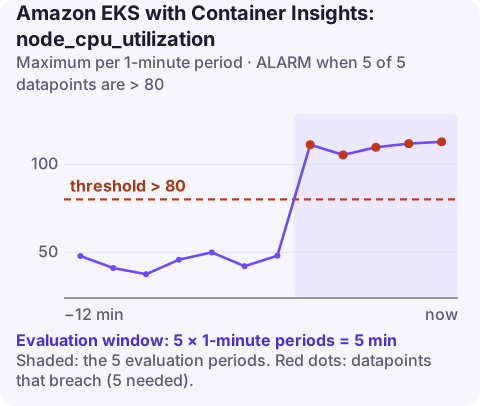
What the metric measures
node_cpu_utilization is the CPU in use on an EKS worker node as a percentage of that node's total CPU. It comes from CloudWatch Container Insights, which on EKS is normally installed as the Amazon CloudWatch Observability add-on, and is published to the ContainerInsights namespace.
The metric exists at several levels: per node (with NodeName and InstanceId) and for the whole cluster (ClusterName only). This alarm uses the cluster-level series. Because each node's agent reports into it, the Maximum statistic tends to follow the busiest node, while Average follows the fleet. Graph both for a day and the gap between them shows how unevenly your workloads are spread.
The figure counts everything on the node: application containers, system pods such as CoreDNS and the CNI plugin, the kubelet and the container runtime. When a node is pinned, the kubelet itself can respond slowly, which shows up as late health checks and pods marked not ready.
Recommended alarm settings
| Setting | Recommended value |
|---|---|
| Namespace | ContainerInsights |
| Metric | node_cpu_utilization |
| Dimensions | ClusterName |
| Statistic | Maximum |
| Threshold | 80 |
| Period | 60 seconds |
| Datapoints to alarm | 5 |
| Evaluation periods | 5 |
| Comparison operator | GreaterThanThreshold |
Tuning: requests, not just usage
Eighty per cent is a ceiling, not a target: AWS suggests staying at or below it so there is time to investigate before users notice. Go lower (70–75) for latency-sensitive workloads or if new nodes take several minutes to join.
The thing most teams miss is how autoscaling decides. Cluster Autoscaler and Karpenter add nodes when pods cannot be scheduled, which depends on CPU requests, not actual usage. A cluster whose pods request 200m but use 900m can sit at 95% CPU with no pending pods, and nothing scales. If this alarm fires while autoscaling stays idle, compare requests with usage:
kubectl top nodes
kubectl describe node ip-10-0-1-23.eu-west-2.compute.internal | grep -A 8 'Allocated resources'
Requests far below real usage means the fix is in the pod specs, not the node count.
Create the alarm
aws cloudwatch put-metric-alarm \
  --alarm-name eks-prod-node-cpu-high \
  --alarm-description "A worker node in prod above 80% CPU for 5 minutes" \
  --namespace ContainerInsights \
  --metric-name node_cpu_utilization \
  --dimensions Name=ClusterName,Value=prod \
  --statistic Maximum \
  --period 60 \
  --evaluation-periods 5 \
  --datapoints-to-alarm 5 \
  --threshold 80 \
  --comparison-operator GreaterThanThreshold \
  --alarm-actions arn:aws:sns:eu-west-2:123456789012:oncall-alerts
When it fires
- Find the hot node or nodes.
kubectl top nodes(it needs metrics-server) or the Container Insights node view in the CloudWatch console. - Find the pods using it.
kubectl top pods -A --sort-by=cpu, then check which of them run on the hot node withkubectl get pods -A -o wide. - One noisy pod? Give it a CPU request that matches reality so the scheduler stops packing other pods next to it, or look at its CPU against its limit.
- Everything is busy? Scale out: more replicas through a Horizontal Pod Autoscaler, more nodes, or larger instance types in the node group.
- Nothing obvious? Look at system pods and DaemonSets, and at log agents that can spike CPU when an application suddenly logs heavily.
Questions
Does this alarm cover every node in the cluster?
It watches the cluster-level series, which every node feeds. To know exactly which node breached, add per-node alarms using the NodeName and InstanceId dimensions, or use the Container Insights console views.
Why isn't my cluster adding nodes when CPU is high?
Node autoscalers react to pods that cannot be scheduled because of their resource requests. High real usage with low requests leaves nothing pending, so no nodes are added.
Hot worker nodes are a capacity question you can often answer by seeing which pods moved where. CloudConsole, a phone app for AWS, is built to show cluster alarms like this one on your phone.
Did it start after a deploy? What changed? on the app’s alarm screen lists the deploys and configuration changes from the hour before the alarm fired.
About the app → · Download on the App Store