 CloudConsole
CloudWatch alarm: EKS node_filesystem_utilization
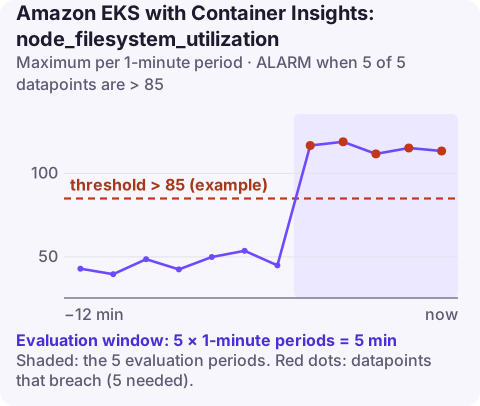
Alarm on ContainerInsights node_filesystem_utilization per ClusterName using the Maximum over 60 seconds, firing when it is above your threshold for 5 of 5 minutes. Set the threshold below the point where the kubelet starts evicting pods for disk pressure (by default when less than 10% is free), leaving enough room for the time it takes you to respond.
What the metric measures
node_filesystem_utilization is the percentage of a worker node's file system that is in use, reported by Container Insights into the ContainerInsights namespace. With only the ClusterName dimension and the Maximum statistic, the alarm reacts to the fullest node reporting, which is what you want: disks fill one node at a time.
What fills a node's disk in Kubernetes:
- Container images, especially on nodes that run many different workloads or large images.
- Container logs written to the node before a log agent ships them.
emptyDirvolumes and writable container layers used as scratch space.
When free space drops below the kubelet's eviction threshold, the node reports the DiskPressure condition, stops accepting new pods and starts evicting existing ones. If the disk fills completely, containers fail to write, image pulls fail and the node can stop responding.
Recommended alarm settings
| Setting | Recommended value |
|---|---|
| Namespace | ContainerInsights |
| Metric | node_filesystem_utilization |
| Dimensions | ClusterName |
| Statistic | Maximum |
| Threshold | Depends on your situation (see method below) |
| Period | 60 seconds |
| Datapoints to alarm | 5 |
| Evaluation periods | 5 |
| Comparison operator | GreaterThanThreshold |
A method for the threshold
- Find your eviction point. The kubelet's default hard eviction signal is
nodefs.available<10%, which is about 90% used. Your node AMI or kubelet configuration may set a different value, so check it. - Note image garbage collection. By default the kubelet starts deleting unused images when disk use passes 85%, and stops at 80%. A node hovering around 85% is often cleaning up normally.
- Measure the fill rate. Chart the metric for two weeks and find the fastest climb, for example 1.5 percentage points an hour during a heavy batch job.
- Multiply by your response time. If it takes three hours to get someone to act, you need 4.5 points of headroom: 90 − 4.5 = 85.5. Round down to 85.
- Sanity-check. If the result is well below 85, expect occasional alarms that clear themselves after image garbage collection; either accept them or reduce the fill rate.
Create the alarm
aws cloudwatch put-metric-alarm \
  --alarm-name eks-prod-node-disk-high \
  --alarm-description "A prod worker node disk above 85% for 5 minutes" \
  --namespace ContainerInsights \
  --metric-name node_filesystem_utilization \
  --dimensions Name=ClusterName,Value=prod \
  --statistic Maximum \
  --period 60 \
  --evaluation-periods 5 \
  --datapoints-to-alarm 5 \
  --threshold 85 \
  --comparison-operator GreaterThanThreshold \
  --alarm-actions arn:aws:sns:eu-west-2:123456789012:oncall-alerts
When it fires
- Find the node. Look for
DiskPressureand recent evictions:kubectl get nodes kubectl describe node ip-10-0-1-23.eu-west-2.compute.internal | grep -i -A 3 pressure kubectl get events -A --field-selector reason=Evicted - See what is using space. Through Session Manager on the node, check the container runtime's image store and the pod log directory with
du -sh. - Short-term relief: cordon and drain the node so its pods move elsewhere, then replace it. A new node starts with an empty disk.
- Long-term fix: give the node group a larger root volume in its launch template, set
ephemeral-storagerequests and limits on pods that write scratch data, capemptyDirsize, and make sure applications are not writing log files inside containers.
The mistake to avoid is restarting evicted pods by hand on the same node: they will be evicted again until space is freed.
Questions
What is the default kubelet disk eviction threshold?
Upstream Kubernetes evicts when nodefs.available falls below 10%, along with image file system and inode thresholds. Managed node AMIs can override these, so confirm in your kubelet configuration.
Why do pods show Evicted with a message about ephemeral storage?
Either the node was under disk pressure, or the pod exceeded its own ephemeral-storage limit. The eviction message names which resource ran short.
Disk pressure gives you a window between the first warning and pods being evicted, and how you use it matters. CloudConsole, a phone app for AWS, is built to put this alarm and the affected cluster on your phone.
Did it start after a deploy? What changed? on the app’s alarm screen lists the deploys and configuration changes from the hour before the alarm fired.
About the app → · Download on the App Store