 CloudConsole
CloudWatch alarm: EKS node_memory_utilization
Alarm on ContainerInsights node_memory_utilization per ClusterName using the Maximum over 60 seconds, firing when it is above 80 for 5 of 5 minutes. It catches worker nodes running short of memory while there is still time to act, before the kubelet evicts pods or the kernel's OOM killer starts ending processes.
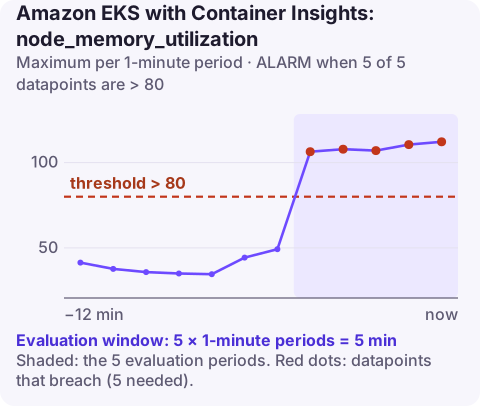
What the metric measures
node_memory_utilization is the memory in use on a worker node, based on its working set, as a percentage of the node's memory. Container Insights publishes it to ContainerInsights; this alarm reads the cluster-wide series with the Maximum statistic, so the most heavily loaded node is what counts.
Memory behaves differently from CPU. A node short of CPU slows everything down; a node short of memory starts removing things. Two mechanisms do that:
| Mechanism | When | What you see |
|---|---|---|
| Kubelet eviction | Free memory drops below the eviction threshold (upstream default: 100Mi available) | Pods with status Evicted, node condition MemoryPressure |
| Kernel OOM killer | Memory runs out faster than the kubelet can react | Containers restarted with reason OOMKilled, sometimes system processes too |
Pods using more than they requested are the first candidates for eviction, so the pods that disappear are not necessarily the ones causing the problem.
Recommended alarm settings
| Setting | Recommended value |
|---|---|
| Namespace | ContainerInsights |
| Metric | node_memory_utilization |
| Dimensions | ClusterName |
| Statistic | Maximum |
| Threshold | 80 |
| Period | 60 seconds |
| Datapoints to alarm | 5 |
| Evaluation periods | 5 |
| Comparison operator | GreaterThanThreshold |
How to tune it
Treat 80 as the upper limit for the threshold. Memory use on a node is usually steadier than CPU, so five minutes above 80% is a real trend rather than a burst, and the remaining 20% is the room you have before eviction.
- Nodes with large memory-hungry pods (caches, JVMs with big heaps) can jump by several gigabytes when one pod schedules. Lower the threshold to 70–75 so a single placement doesn't take you from fine to evicting.
- Clusters that are deliberately packed with well-understood workloads can live near 80. Raise requests to match usage first, then decide whether the alarm is too sensitive.
- Per-node alarms using
NodeNameandInstanceIdgive you the node name in the alert, at the cost of managing an alarm per node.
Create the alarm
aws cloudwatch put-metric-alarm \
  --alarm-name eks-prod-node-memory-high \
  --alarm-description "A prod worker node above 80% memory for 5 minutes" \
  --namespace ContainerInsights \
  --metric-name node_memory_utilization \
  --dimensions Name=ClusterName,Value=prod \
  --statistic Maximum \
  --period 60 \
  --evaluation-periods 5 \
  --datapoints-to-alarm 5 \
  --threshold 80 \
  --comparison-operator GreaterThanThreshold \
  --alarm-actions arn:aws:sns:eu-west-2:123456789012:oncall-alerts
Before creating it, confirm the cluster is publishing the metric with list-metrics on the ContainerInsights namespace; a misspelt cluster name gives an alarm that stays in INSUFFICIENT_DATA for ever.
When it fires
- Check for damage already done.
kubectl get events -A --field-selector reason=Evictedandkubectl get pods -A | grep -i oomshow whether pods have been evicted or killed. - Find the biggest consumers.
kubectl top pods -A --sort-by=memory. Compare each one's usage with its memory request: the gap is memory the scheduler doesn't know about. - Look for growth over time. A pod whose memory climbs until it restarts is leaking; its own limit alarm, pod_memory_utilization_over_pod_limit, should be firing too.
- Add room. Increase replicas so load spreads, add nodes, or move to instance types with more memory per vCPU. Remember that node autoscalers only add capacity for pods that cannot be scheduled, which depends on requests.
- Fix the requests. Setting memory requests close to real usage is what stops the scheduler from overpacking nodes in the first place.
Questions
What is the difference between node memory alarms and pod memory alarms?
The node alarm tells you a machine is running short, whatever the cause. The pod alarm compares each pod with its own limit and points at a specific workload.
Why were my pods evicted when they were within their limits?
Under memory pressure the kubelet evicts pods that are using more than they requested, even if they are below their limit. Requests that match real usage make this much less likely.
Memory pressure on a node turns into evictions within minutes, so the alert needs to reach you wherever you are. CloudConsole, a phone app for AWS, is built to show EKS alarms like this one on your phone.
Did it start after a deploy? What changed? on the app’s alarm screen lists the deploys and configuration changes from the hour before the alarm fired.
About the app → · Download on the App Store