 CloudConsole
CloudWatch alarm: EKS pod_memory_utilization_over_pod_limit
Alarm on ContainerInsights pod_memory_utilization_over_pod_limit per ClusterName, Namespace and Service using the Maximum over 60 seconds, firing when it is above 80 for 5 of 5 minutes. A pod at 100% of its memory limit is killed and restarted, so this alarm gives you warning while it is still at 80%.
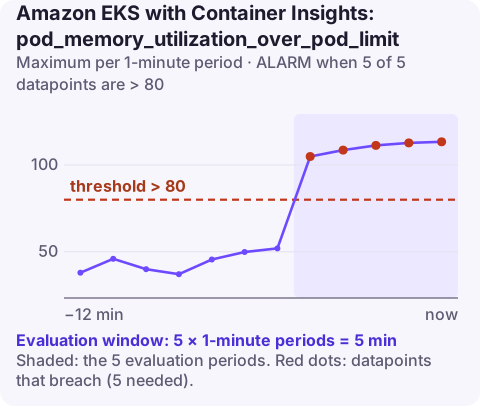
What the metric measures
pod_memory_utilization_over_pod_limit is a pod's memory use as a percentage of the memory limit on its containers. It is a Container Insights metric in the ContainerInsights namespace; the alarm groups pods by namespace and by the Kubernetes Service that routes to them, and takes the Maximum, so a single pod near its limit is enough.
Unlike CPU, memory limits are enforced by killing. When a container tries to go past its limit, the kernel ends it and Kubernetes records the reason:
Last State:     Terminated
  Reason:       OOMKilled
  Exit Code:    137
The container restarts, the pod's restart count goes up, and if it keeps happening the pod ends up in CrashLoopBackOff with growing delays between attempts. Meanwhile, any requests it was handling fail.
As with the CPU version, pods without a memory limit do not report this metric, and pods not selected by a Service do not appear under the Service dimension.
Recommended alarm settings
| Setting | Recommended value |
|---|---|
| Namespace | ContainerInsights |
| Metric | pod_memory_utilization_over_pod_limit |
| Dimensions | ClusterName, Namespace, Service |
| Statistic | Maximum |
| Threshold | 80 |
| Period | 60 seconds |
| Datapoints to alarm | 5 |
| Evaluation periods | 5 |
| Comparison operator | GreaterThanThreshold |
Setting the threshold for your workload
Stay at or below 80. How much lower depends on how memory grows in the application:
| Pattern | Threshold |
|---|---|
| Flat, predictable usage (most stateless web services) | 80 |
| Spiky usage driven by request size (file processing, report generation) | 65–70, so one large request still fits |
| Runtime that reserves memory up front (a JVM with a fixed heap) | 80, but only after capping the heap well below the limit; otherwise usage sits high by design and the alarm never clears |
For runtimes like the JVM, a common cause of OOM kills is a heap sized independently of the container. Set the heap as a share of the container limit (for example with -XX:MaxRAMPercentage) so thread stacks, metaspace and native buffers still fit.
Create the alarm
aws cloudwatch put-metric-alarm \
  --alarm-name eks-prod-search-pod-memory-near-limit \
  --alarm-description "A search pod above 80% of its memory limit for 5 minutes" \
  --namespace ContainerInsights \
  --metric-name pod_memory_utilization_over_pod_limit \
  --dimensions Name=ClusterName,Value=prod Name=Namespace,Value=shop \
      Name=Service,Value=search \
  --statistic Maximum \
  --period 60 \
  --evaluation-periods 5 \
  --datapoints-to-alarm 5 \
  --threshold 80 \
  --comparison-operator GreaterThanThreshold \
  --alarm-actions arn:aws:sns:eu-west-2:123456789012:oncall-alerts
When it fires
- Check for OOM kills already happening.
kubectl get pods -n shopshows restart counts;kubectl describe podon a restarting pod showsOOMKilledunder the last state. - Leak or load? Graph the metric over a day. A sawtooth that climbs steadily and drops at each restart is a leak. A level that rises and falls with traffic is load.
- For load: add replicas so each pod handles less, or raise the memory limit and the request together. Raising only the limit makes the scheduler place the pod as if it needed less than it does.
- For a leak: raise the limit to stop the restarts while you find it, then capture a heap profile from a pod that has been running for a while and compare it with a fresh one.
- Watch the node. Bigger limits across many pods add up; keep an eye on node memory after the change.
Questions
What does exit code 137 mean in Kubernetes?
The container was killed with SIGKILL. When the reason shown is OOMKilled, it went over its memory limit; otherwise something else stopped it forcefully.
Should memory requests equal memory limits?
Setting them equal gives the most predictable behaviour, because the scheduler reserves exactly what the pod may use and the pod is less likely to be evicted under node pressure. Lower requests pack nodes tighter at the cost of that predictability.
A pod creeping towards its memory limit usually fails at the worst moment, under peak load. CloudConsole, a phone app for AWS, is built to show alarms like this one, alongside the related node metrics, on your phone.
Did it start after a deploy? What changed? on the app’s alarm screen lists the deploys and configuration changes from the hour before the alarm fired.
About the app → · Download on the App Store