 CloudConsole
CloudWatch alarm for EC2 CPUUtilization
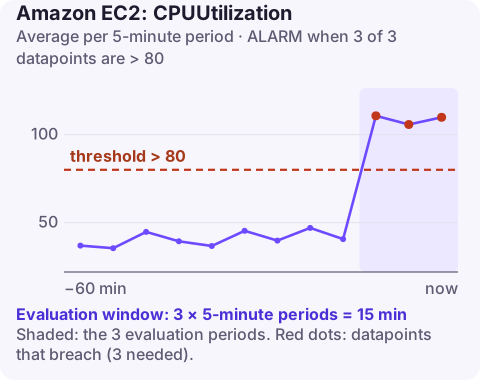
Alarm on CPUUtilization for each instance (InstanceId) using the Average statistic, and go into ALARM when it is above 80% for 3 of 3 five-minute periods. With detailed monitoring enabled you can use a 60-second period instead. Treat it as a capacity warning, not proof of a problem: some workloads run hot by design.
What CPUUtilization measures
CPUUtilization is the percentage of the instance's allocated compute that was in use, as measured by the hypervisor rather than the guest OS. That has two practical consequences:
- It can differ from
topinside the instance, especially on burstable types. - On a T-family instance in standard mode, the metric is measured against the full vCPU. When CPU credits run out, the instance is held at its baseline (for example 20% on some sizes), and
CPUUtilizationflattens at that baseline while the application crawls. An 80% alarm never fires. Alarm onCPUCreditBalancefor those instances as well.
Without detailed monitoring, EC2 publishes this metric every five minutes, which is why the recommended period is 300 seconds.
Recommended alarm settings
| Setting | Value |
|---|---|
| Namespace | AWS/EC2 |
| Metric | CPUUtilization |
| Dimensions | InstanceId |
| Statistic | Average |
| Period | 300 seconds |
| Datapoints to alarm | 3 |
| Evaluation periods | 3 |
| Comparison operator | GreaterThanThreshold |
| Threshold | 80.0 (percent) |
As given in the CloudWatch recommended alarms list. Three five-minute periods means CPU has been above 80% for a quarter of an hour, long enough to rule out a deploy or a cron job.
Tuning
- Look at history first. If an instance sits at 85% every afternoon and nobody complains, 80% will page you daily. Raise the threshold or accept that this instance is sized to run hot.
- Batch and worker instances are supposed to use all their CPU. For them, alarm on queue age or job duration, not CPU.
- Auto Scaling groups: alarm on the group's average (
AutoScalingGroupNamedimension) rather than each instance, and let a target tracking policy handle routine load. - Faster detection: with detailed monitoring on, use
--period 60and around 10 evaluation periods to keep a similar time window.
Create it
aws cloudwatch put-metric-alarm \
  --alarm-name web-01-cpu-high \
  --namespace AWS/EC2 \
  --metric-name CPUUtilization \
  --dimensions Name=InstanceId,Value=i-0123456789abcdef0 \
  --statistic Average \
  --period 300 \
  --evaluation-periods 3 \
  --datapoints-to-alarm 3 \
  --threshold 80 \
  --comparison-operator GreaterThanThreshold \
  --alarm-actions arn:aws:sns:eu-west-2:123456789012:ops-alerts \
  --region eu-west-2
The console path and email notifications are covered in how to create a CloudWatch CPU alarm and alarm email notifications.
When it fires
- Is the application actually degraded? Check response times and error rates. High CPU with normal latency is a capacity note, not an incident.
- Find the process. Connect with Session Manager and run
top -o %CPU. A runaway process, a stuck loop or an unexpected crypto-miner on a compromised host all show up here. - Look for a trigger: a traffic increase, a deploy, a cache that stopped working and pushed more work to this host.
- Add capacity if the load is real: scale out behind the load balancer, or move to a larger or compute-optimised instance type.
Questions
What is a good CPU threshold for an EC2 alarm?
AWS suggests 70-80%, with 80% as the recommended value. Adjust it after looking at what normal looks like for the instance.
Why does my EC2 CPU alarm only update every 5 minutes?
Basic monitoring publishes EC2 metrics every five minutes. Enable detailed monitoring for one-minute data, at extra cost.
Why is my T3 instance slow but CPU only 20%?
It has probably run out of CPU credits and is being held at its baseline. Check CPUCreditBalance, or switch the instance to unlimited mode or a non-burstable type.
CPU alarms are among the most common to arrive while you are away, and most can wait until morning. CloudConsole, a phone app for AWS, is built to show the CPU graph and the application's latency together on a phone so you can make that call.
Did it start after a deploy? What changed? on the app’s alarm screen lists the deploys and configuration changes from the hour before the alarm fired.
About the app → · Download on the App Store