 CloudConsole
aws cloudwatch list-metrics
aws cloudwatch list-metrics --namespace AWS/Lambda --metric-name Errors lists every metric with that name and the exact dimension combinations it is published with. Use it before writing an alarm or a get-metric-statistics call, because dimensions have to match exactly; it returns names and dimensions only, never values.
What the command does
The command lists metrics that have received data recently, as Metrics[] entries with Namespace, MetricName and Dimensions. Each unique combination of name and dimensions is a separate metric, which is why the same metric name often appears many times: once per instance, per function, per function and version, and so on.
Metrics that have had no new data for about two weeks drop out of the listing, even though their old datapoints can still be queried.
Syntax
aws cloudwatch list-metrics \
  [--namespace AWS/EC2] [--metric-name CPUUtilization] \
  [--dimensions Name=InstanceId,Value=i-0123456789abcdef0] \
  [--recently-active PT3H] \
  [--include-linked-accounts]
A dimension filter can omit Value to match any metric that has that dimension name.
Worked examples
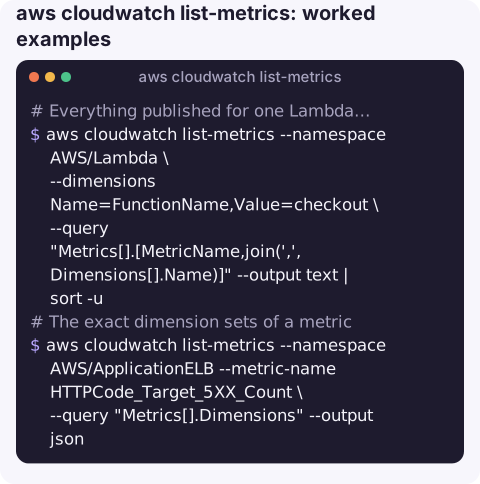
Everything published for one Lambda function:
aws cloudwatch list-metrics --namespace AWS/Lambda \
  --dimensions Name=FunctionName,Value=checkout \
  --query "Metrics[].[MetricName,join(',',Dimensions[].Name)]" --output text | sort -u
The exact dimension sets of a metric, which is what an alarm must use:
aws cloudwatch list-metrics --namespace AWS/ApplicationELB --metric-name HTTPCode_Target_5XX_Count \
  --query "Metrics[].Dimensions" --output json
Load balancer metrics, for example, exist both per load balancer and per load balancer plus target group, and an alarm using one set does not see data from the other.
Metrics that reported in the last three hours (the only accepted value):
aws cloudwatch list-metrics --namespace MyApp --recently-active PT3H \
  --query "Metrics[].MetricName" --output text
Which namespaces have data in this region:
aws cloudwatch list-metrics --query "Metrics[].Namespace" --output text | tr '\t' '\n' | sort | uniq -cThis pages through every metric in the region, which can take a while in a busy account.
Every instance reporting CPU:
aws cloudwatch list-metrics --namespace AWS/EC2 --metric-name CPUUtilization \
  --dimensions Name=InstanceId \
  --query "Metrics[].Dimensions[0].Value" --output text
Common namespaces and key dimensions
| Namespace | Typical dimensions |
|---|---|
AWS/EC2 | InstanceId, AutoScalingGroupName |
AWS/Lambda | FunctionName, FunctionName+Resource |
AWS/ApplicationELB | LoadBalancer, TargetGroup |
AWS/RDS | DBInstanceIdentifier, DBClusterIdentifier |
AWS/SQS | QueueName |
AWS/ECS | ClusterName, ServiceName |
Gotchas
- New metrics can take up to 15 minutes to appear here after their first datapoint, although
get-metric-statisticscan read them sooner, so a missing custom metric is not necessarily a failure. - Not every metric is always published. Some appear only when there is something to report, so an absent metric can just mean zero activity.
- Case matters in namespaces, names and dimension values.
- No statistics here. To read values, follow up with
get-metric-statisticsorget-metric-data. - Cross-account monitoring. In a monitoring account set up for cross-account observability,
--include-linked-accountsadds metrics from source accounts and--owning-accountnarrows the list to one of them.
Questions
How do I list CloudWatch metrics for a resource?
Filter list-metrics with --namespace and --dimensions Name=<dimension>,Value=<resource id>, for example Name=InstanceId,Value=i-0123456789abcdef0.
How do I list CloudWatch alarms rather than metrics?
Use aws cloudwatch describe-alarms, optionally with --state-value ALARM.
How do I list CloudWatch log groups?
Logs are separate: aws logs describe-log-groups lists log groups, and aws logs describe-log-streams lists streams in one group.
Picking the right metric is half of writing a good alarm. CloudConsole, a phone app for AWS, is built to show alarms together with the metrics behind them on a phone.
About the app → · Download on the App Store