 CloudConsole
CloudWatch alarm for ElastiCache CPUUtilization
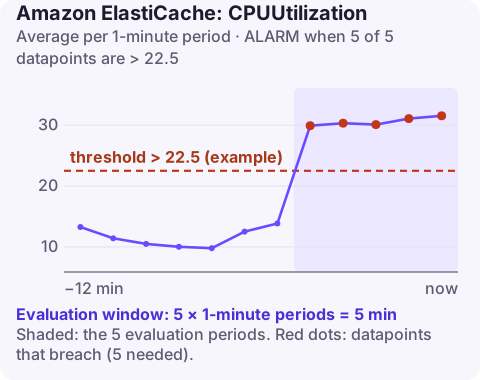
CPUUtilization is the CPU use of the whole ElastiCache node, engine plus operating system, per CacheClusterId and CacheNodeId. AWS recommends alarming on the Average above a threshold you calculate for 5 of 5 one-minute periods. For Memcached, about 90% works; for Redis OSS or Valkey, divide 90 by the node's vCPU count, because the engine runs commands on one core.
Why the threshold depends on the engine
The metric is averaged across all of the node's vCPUs. Memcached runs many worker threads and can use all of them, so 90% host CPU really does mean the node is nearly full.
Redis OSS and Valkey execute commands on a single main thread. On a node with 4 vCPUs, that thread can be completely saturated while CPUUtilization reads only about 25%. Hence the rule of thumb:
| Node vCPUs | Redis OSS / Valkey threshold (90 / vCPUs) |
|---|---|
| 2 | 45 |
| 4 | 22.5 |
| 8 | 11.25 |
On nodes with more than two vCPUs, the EngineCPUUtilization alarm measures the engine thread directly and is easier to reason about. Keep this host-level alarm for small nodes and to catch non-engine load such as snapshots and replication.
Recommended alarm settings
| Setting | Value |
|---|---|
| Namespace | AWS/ElastiCache |
| Metric | CPUUtilization |
| Dimensions | CacheClusterId, CacheNodeId |
| Statistic | Average |
| Period | 60 seconds |
| Datapoints to alarm | 5 |
| Evaluation periods | 5 |
| Comparison operator | GreaterThanThreshold |
| Threshold | Depends on your situation: about 90% of available CPU, adjusted for the engine |
From the CloudWatch recommended alarms page. Each node reports separately; in a Redis OSS replication group, CacheClusterId is the node's own ID such as sessions-001 and CacheNodeId is 0001.
Create it
# 22.5 = 90 / 4 vCPUs for a Redis OSS node
aws cloudwatch put-metric-alarm \
  --alarm-name sessions-001-host-cpu \
  --namespace AWS/ElastiCache \
  --metric-name CPUUtilization \
  --dimensions Name=CacheClusterId,Value=sessions-001 Name=CacheNodeId,Value=0001 \
  --statistic Average \
  --period 60 \
  --evaluation-periods 5 \
  --datapoints-to-alarm 5 \
  --threshold 22.5 \
  --comparison-operator GreaterThanThreshold \
  --alarm-actions arn:aws:sns:eu-west-2:123456789012:ops-alerts \
  --region eu-west-2
Create one alarm per node, including replicas. Read replicas can run hot on their own if the application sends heavy reads to them.
Tuning for noise
Host CPU includes work that is not serving clients: snapshot creation, replica synchronisation after a failover, and engine housekeeping. If the alarm fires every night during the backup window, either take backups from a replica or accept a slightly higher threshold for the primary. Five breaching minutes in a row is long enough to ignore a short spike from a single bulk operation. For Memcached, the useful ceiling also depends on the num_threads setting; a node with more cores than worker threads cannot reach 100% host CPU.
When it fires
- Memcached: scale up to a larger node type or add nodes and spread keys across them.
- Redis OSS / Valkey, read-heavy: add read replicas and point read traffic at the reader endpoint.
- Redis OSS / Valkey, write-heavy: with cluster mode enabled, add shards to spread writes across more primaries; with cluster mode disabled, scale up the node type.
- Background work: if spikes line up with the daily backup window, take snapshots from a replica or move the window.
- Expensive commands: see the engine CPU page for slow-log diagnosis.
AWS's scaling guide covers each path.
Questions
Why is my ElastiCache CPU only 25% when Redis is overloaded?
Redis OSS runs commands on one thread. On a 4-vCPU node, one fully busy core shows as about 25% host CPU. Use EngineCPUUtilization or divide your threshold by the vCPU count.
Which ElastiCache CPU metric should I alarm on?
For Redis OSS or Valkey nodes with more than two vCPUs, EngineCPUUtilization. For smaller nodes and Memcached, CPUUtilization.
Do I need an alarm per node?
Yes. The metric is reported per node, and replicas can be busier than the primary.
Cache CPU problems quickly become database problems as misses pile up. CloudConsole, a phone app for AWS, is built to show each node's CPU alarm on a phone so you can see which node is hot.
Did it start after a deploy? What changed? on the app’s alarm screen lists the deploys and configuration changes from the hour before the alarm fired.
About the app → · Download on the App Store