 CloudConsole
CloudWatch alarm for ElastiCache CurrConnections
CurrConnections is the number of client connections open on an ElastiCache node, excluding connections from read replicas. AWS recommends alarming when its Average for a CacheClusterId and CacheNodeId stays above a threshold you set from your normal baseline for 10 of 10 one-minute periods; each node supports up to 65,000 connections.
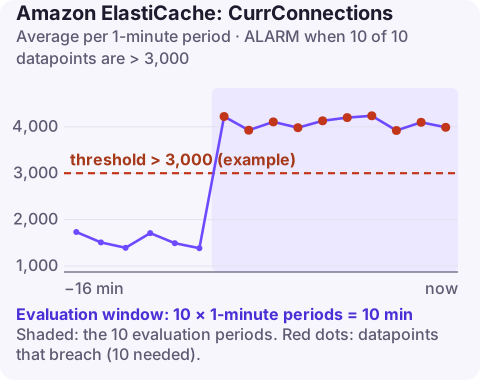
What drives connection counts up
A well-behaved application keeps a fixed pool of connections per process, so CurrConnections tracks the number of application instances and stays flat. It climbs for other reasons:
- Leaks: code that opens a client per request and never closes it. The count rises steadily until restarts reset it.
- Lambda functions creating clients in the handler instead of outside it, so every invocation opens a new connection; concurrency spikes become connection spikes.
- Dead peers: clients that vanished (terminated containers, network drops) without closing, leaving connections the server still counts.
- Scale-out events that multiply pool size by instance count.
Opening connections is not free, especially with TLS, so a storm of new connections also raises engine CPU.
Recommended alarm settings
| Setting | Value |
|---|---|
| Namespace | AWS/ElastiCache |
| Metric | CurrConnections |
| Dimensions | CacheClusterId, CacheNodeId |
| Statistic | Average |
| Period | 60 seconds |
| Datapoints to alarm | 10 |
| Evaluation periods | 10 |
| Comparison operator | GreaterThanThreshold |
| Threshold | Depends on your situation: above your normal peak, well below 65,000 |
Settings as published on the CloudWatch recommended alarms page.
Choosing a threshold
- Graph
CurrConnectionsper node over two weeks, including deploys and peak scaling. - Calculate the expected maximum: instances at full scale multiplied by pool size per instance. Compare it with what you observe.
- Set the threshold about 50% above the larger of the two, as long as that is comfortably below 65,000.
A steady upward slope that never comes down is a leak even if it is far from the threshold; a separate trend check on NewConnections helps spot it.
Create it
# 3000 is an example: about 1.5x the observed peak for this node
aws cloudwatch put-metric-alarm \
  --alarm-name sessions-001-connections \
  --namespace AWS/ElastiCache \
  --metric-name CurrConnections \
  --dimensions Name=CacheClusterId,Value=sessions-001 Name=CacheNodeId,Value=0001 \
  --statistic Average \
  --period 60 \
  --evaluation-periods 10 \
  --datapoints-to-alarm 10 \
  --threshold 3000 \
  --comparison-operator GreaterThanThreshold \
  --alarm-actions arn:aws:sns:eu-west-2:123456789012:ops-alerts \
  --region eu-west-2
When it fires
- Is it a leak or a surge? A sawtooth that resets on every deploy is a leak; a step that follows scaling events is a surge.
- Find the client. Connect with a client and run
CLIENT LISTto see source addresses and idle times. Many connections from one host or with huge idle times point to the culprit. - Close idle connections server-side. Set the
timeoutparameter in the parameter group to drop clients idle for longer than N seconds, and tunetcp-keepaliveso dead peers are detected. - Fix the application: reuse a single client or pool per process; for Lambda, create the client outside the handler.
Questions
What is the maximum number of connections for ElastiCache?
Each node supports up to 65,000 concurrent client connections.
Does CurrConnections include replication connections?
No. Connections from read replicas are excluded; the metric counts client connections.
How do I close idle Redis OSS connections in ElastiCache?
Set the timeout parameter in the cluster's parameter group, which disconnects clients idle longer than that many seconds.
Connection leaks build slowly and then fail suddenly when a node runs out. CloudConsole, a phone app for AWS, is built to show this alarm with the connection trend so you can see whether it is a leak or a spike.
Did it start after a deploy? What changed? on the app’s alarm screen lists the deploys and configuration changes from the hour before the alarm fired.
About the app → · Download on the App Store