 CloudConsole
CloudWatch alarm for ElastiCache EngineCPUUtilization
EngineCPUUtilization is the CPU use of the Redis OSS or Valkey engine thread itself, per CacheClusterId. AWS recommends alarming when its Average is above 90% for 5 of 5 one-minute periods. Because that thread runs every command, sustained high values mean added latency for every client.
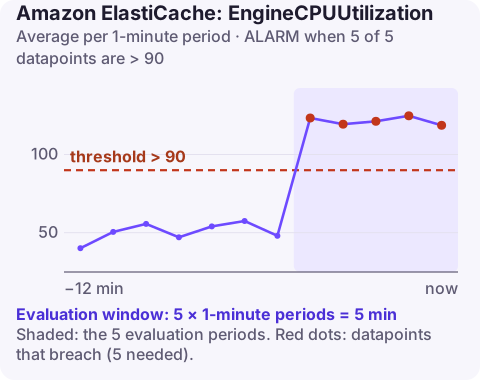
Why the engine thread matters
Redis OSS and Valkey process commands one after another on a main thread. Host-level CPU can look low while that thread is saturated, which is why this metric exists. Once it nears 100%, commands queue: latency rises for everyone, including the cheap GETs, and timeouts start in clients.
The common drivers:
- Expensive commands:
KEYS,SMEMBERSorHGETALLon very large collections,ZRANGEover huge ranges, long Lua scripts. - Sheer request rate, often from a cache-stampede when a popular key expires.
- Connection churn: many new connections in a short time, especially with TLS.
- Evictions: when memory is full, the engine spends time finding keys to evict on every write.
Recommended alarm settings
| Setting | Value |
|---|---|
| Namespace | AWS/ElastiCache |
| Metric | EngineCPUUtilization |
| Dimensions | CacheClusterId |
| Statistic | Average |
| Period | 60 seconds |
| Datapoints to alarm | 5 |
| Evaluation periods | 5 |
| Comparison operator | GreaterThanThreshold |
| Threshold | 90.0 (percent) |
As listed in the CloudWatch recommended alarms reference. Unlike most ElastiCache alarms, AWS gives a fixed starting value here.
Tuning
Benchmark if you can: run your application's workload against a test cluster and note the engine CPU at which client p99 latency starts to rise. Set the threshold a little below that. Without a benchmark, 90% is reasonable for most workloads; latency-sensitive services may prefer 75–80% for earlier warning. For nodes with two or fewer vCPUs, also keep the host CPUUtilization alarm.
Create it
aws cloudwatch put-metric-alarm \
  --alarm-name sessions-001-engine-cpu \
  --namespace AWS/ElastiCache \
  --metric-name EngineCPUUtilization \
  --dimensions Name=CacheClusterId,Value=sessions-001 \
  --statistic Average \
  --period 60 \
  --evaluation-periods 5 \
  --datapoints-to-alarm 5 \
  --threshold 90 \
  --comparison-operator GreaterThanThreshold \
  --alarm-actions arn:aws:sns:eu-west-2:123456789012:ops-alerts \
  --region eu-west-2
Create one per node, primaries and replicas alike.
One trap when it fires: moving to a node type with more vCPUs does little for a saturated command thread, because that thread still runs on one core. For write-bound load, spreading keys across more shards is what adds command-processing capacity.
When it fires
- Read the slow log. Run
SLOWLOG GET 25from a client, or deliver the slow log to CloudWatch Logs through the cluster's log delivery settings. Commands taking milliseconds are your suspects. - Replace blocking patterns:
SCANinstead ofKEYS, paginated reads of big sets and hashes, and smaller collections overall. - Check for a stampede. A spike in
GetTypeCmdsright after a popular key expired means many clients rebuilding it at once; add request coalescing or jittered TTLs. - Scale: add replicas for read load; add shards (cluster mode enabled) or a larger node type for write load. See scaling ElastiCache.
- Check CurrConnections and evictions for the same period.
Questions
What is the difference between CPUUtilization and EngineCPUUtilization?
CPUUtilization covers the whole host averaged over all vCPUs. EngineCPUUtilization covers only the engine thread that runs commands, so it shows saturation that host CPU hides.
Is 90% engine CPU safe?
It is AWS's suggested alarm point. Many teams alarm earlier because latency for every command rises as the thread approaches full use.
How do I find slow Redis commands in ElastiCache?
Use SLOWLOG GET from a client, or enable slow log delivery to CloudWatch Logs or Kinesis Data Firehose.
An engine CPU alarm usually comes with application timeouts, so it tends to be urgent. CloudConsole, a phone app for AWS, is built to show it with connection and eviction metrics on a phone so the cause is easier to spot.
Did it start after a deploy? What changed? on the app’s alarm screen lists the deploys and configuration changes from the hour before the alarm fired.
About the app → · Download on the App Store