 CloudConsole
CloudWatch alarm for ElastiCache DatabaseMemoryUsagePercentage
DatabaseMemoryUsagePercentage is how much of the memory available to the Redis OSS or Valkey engine (its maxmemory) is in use, per CacheClusterId. AWS recommends alarming on the Average above a threshold you choose for 5 of 5 one-minute periods. At 100%, the eviction policy kicks in, and if nothing can be evicted, writes fail.
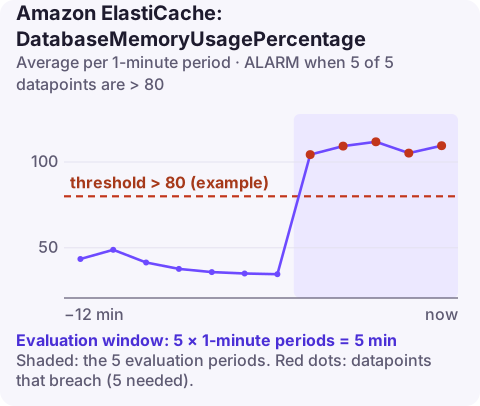
What happens as memory fills
The percentage is used memory divided by maxmemory, the part of the node's RAM the engine is allowed to use after ElastiCache reserves some for background work such as snapshots and replication. Reaching 100% is not a crash; it triggers the maxmemory-policy:
| Policy style | At 100% |
|---|---|
volatile-lru and other volatile-* | Evicts keys that have a TTL; if none are left, writes fail |
allkeys-lru / allkeys-lfu | Evicts any key; behaves like a classic cache |
noeviction | Rejects writes with an out-of-memory error |
The reserved share is controlled by the reserved-memory-percent parameter; lowering it raises maxmemory but leaves less room for snapshots, which can make the node swap during backups. Whether this alarm matters depends on the eviction policy. A pure cache with allkeys-lru is designed to sit near 100%. A cluster used as a session store, queue or primary data store must never get there.
Recommended alarm settings
| Setting | Value |
|---|---|
| Namespace | AWS/ElastiCache |
| Metric | DatabaseMemoryUsagePercentage |
| Dimensions | CacheClusterId |
| Statistic | Average |
| Period | 60 seconds |
| Datapoints to alarm | 5 |
| Evaluation periods | 5 |
| Comparison operator | GreaterThanThreshold |
| Threshold | Depends on your situation: the level that leaves you time to scale |
From AWS's CloudWatch recommended alarms page.
Choosing a threshold
- Data you cannot lose (sessions, rate-limit counters, anything without a backing store): alarm at 75–80%, leaving time to scale before evictions or write failures.
- Caches that expect eviction: this alarm will fire constantly. Alarm on the
Evictionsmetric rising well above its normal rate instead, together with a drop in cache hit rate. - Growth rate matters: graph the metric over a month. If it rises a few points a week, set the threshold so that the alarm fires several weeks before 100%.
Create it
# 80% suits a session store; caches that rely on eviction should alarm on Evictions instead
aws cloudwatch put-metric-alarm \
  --alarm-name sessions-memory-high \
  --namespace AWS/ElastiCache \
  --metric-name DatabaseMemoryUsagePercentage \
  --dimensions Name=CacheClusterId,Value=sessions-001 \
  --statistic Average \
  --period 60 \
  --evaluation-periods 5 \
  --datapoints-to-alarm 5 \
  --threshold 80 \
  --comparison-operator GreaterThanThreshold \
  --alarm-actions arn:aws:sns:eu-west-2:123456789012:ops-alerts \
  --region eu-west-2
When it fires
- Find what is growing. Keys without a TTL that were meant to expire are the usual cause. Sample keys with
SCANandTTL, or useMEMORY USAGEon suspect keys. AvoidKEYS *in production. - Add TTLs in the application where data is temporary.
- Add memory: scale up to a larger node type, or with cluster mode enabled, add shards to spread the data. See AWS's scaling guide.
- Check the policy with
aws elasticache describe-cache-parameters --cache-parameter-group-name my-params --query "Parameters[?ParameterName=='maxmemory-policy']"; it may not be what the application expects.
Questions
What happens when ElastiCache memory reaches 100%?
The eviction policy runs. With a volatile policy and no keys with a TTL, or with noeviction, write commands fail with an out-of-memory error.
Is high DatabaseMemoryUsagePercentage bad for a cache?
Not necessarily. A cache using allkeys-lru is meant to fill up and evict. Watch evictions and hit rate instead.
Why is maxmemory lower than the node's RAM?
ElastiCache reserves part of the memory for snapshots, replication and overhead, so the engine gets less than the full node size.
A cache running out of memory can quietly drop sessions or fail writes. CloudConsole, a phone app for AWS, is built to show this alarm with the memory trend so you can see how much time you have.
Did it start after a deploy? What changed? on the app’s alarm screen lists the deploys and configuration changes from the hour before the alarm fired.
About the app → · Download on the App Store