 CloudConsole
CloudWatch alarm: RDS FreeableMemory
Alarm on AWS/RDS FreeableMemory per DBInstanceIdentifier with the Average over 60 seconds, firing when it is below your threshold for 15 consecutive minutes. For RDS, set the threshold to about 25% of the instance class's memory, in bytes; for Aurora, around 5%, because Aurora deliberately uses most of its memory for caching.
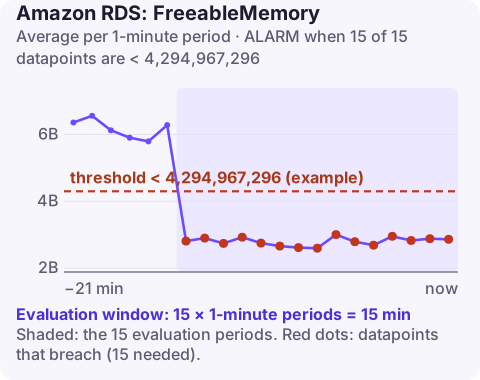
What the metric measures
FreeableMemory is RAM that the operating system could give to processes, reported in bytes. Database engines use memory heavily on purpose: the buffer pool or shared buffers, per-connection memory and sort or hash areas. A low but stable value is often fine. A value that keeps falling, or that drops alongside rising SwapUsage, means memory pressure, which slows queries and can end with the engine being restarted.
Common drivers: a jump in connections (each one has its own memory), large per-session settings such as PostgreSQL work_mem multiplied by many parallel sorts, a buffer pool configured too large for the instance class, and memory-hungry features like many partitions or prepared statements.
Engines that rely on the operating system's page cache, PostgreSQL in particular, let that cache grow into free memory, so a moderate, flat value is expected and healthy. The useful signal is the trend and the lowest values during peaks, not the average level.
Recommended alarm settings
| Setting | Recommended value |
|---|---|
| Namespace | AWS/RDS |
| Metric | FreeableMemory |
| Dimensions | DBInstanceIdentifier |
| Statistic | Average |
| Threshold | Depends on your situation (see method below) |
| Period | 60 seconds |
| Datapoints to alarm | 15 |
| Evaluation periods | 15 |
| Comparison operator | LessThanThreshold |
Computing the threshold in bytes
- Find the memory of the instance class from the instance class documentation. For example, a class with 16 GiB has 17,179,869,184 bytes.
- RDS: 25% of that is 4,294,967,296 bytes (4 GiB).
- Aurora: 5% is about 858,993,459 bytes. Aurora reaching near zero means the instance has no more room to grow its cache and connections.
- Compare with two weeks of history. If the instance normally sits just above your number, the alarm will be noisy; investigate why rather than lowering it blindly.
Remember to update the threshold when you change instance class; a value calculated for a larger class will fire constantly on a smaller one.
Create the alarm
aws cloudwatch put-metric-alarm \
  --alarm-name rds-orders-db-freeable-memory-low \
  --alarm-description "orders-db freeable memory below 25% (4 GiB) for 15 minutes" \
  --namespace AWS/RDS \
  --metric-name FreeableMemory \
  --dimensions Name=DBInstanceIdentifier,Value=orders-db \
  --statistic Average \
  --period 60 \
  --evaluation-periods 15 \
  --datapoints-to-alarm 15 \
  --threshold 4294967296 \
  --comparison-operator LessThanThreshold \
  --alarm-actions arn:aws:sns:eu-west-2:123456789012:oncall-alerts
When it fires
- Check swap and connections: graph
SwapUsageandDatabaseConnectionsfor the same window. A connection spike explains most sudden drops. - Look at Enhanced Monitoring process lists, if enabled, to see which processes hold memory.
- Review memory parameters in the parameter group: buffer pool,
work_memorsort_buffer_size, and maximum connections. - Reduce load or scale: pool connections (RDS Proxy helps), move reads to replicas (for Aurora, add a reader), or move to a larger instance class.
Questions
Which CloudWatch alarms should I set for RDS?
A practical baseline is CPUUtilization, FreeStorageSpace, FreeableMemory, DatabaseConnections, ReadLatency and WriteLatency, plus ReplicaLag on replicas. Aurora clusters add metrics such as DBLoad and BufferCacheHitRatio.
Is low FreeableMemory on Aurora normal?
Fairly low values are normal because Aurora uses memory aggressively for caching. Values approaching zero are not, which is why the suggested Aurora threshold is around 5%.
Memory alarms on a database often build slowly over hours, so a quick look at the trend tells you if it can wait until morning. CloudConsole, a phone app for AWS, is built to show exactly that on your phone.
Did it start after a deploy? What changed? on the app’s alarm screen lists the deploys and configuration changes from the hour before the alarm fired.
About the app → · Download on the App Store