 CloudConsole
CloudWatch alarm: RDS CPUUtilization
Alarm on AWS/RDS CPUUtilization per DBInstanceIdentifier with the Average over 60 seconds, firing when it is above 90% for 5 consecutive minutes. Sustained CPU at that level makes queries queue, raises response times and leads to client timeouts, so the alarm targets persistent saturation rather than short spikes.
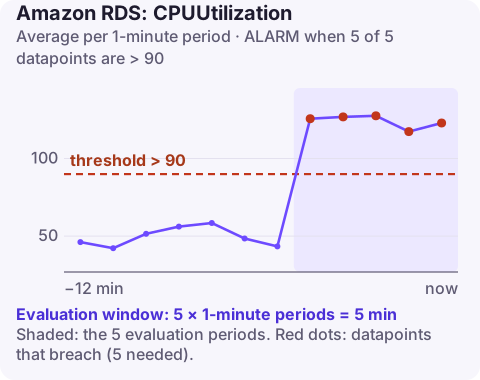
What the metric measures
CPUUtilization is the percentage of the DB instance's CPU that is not idle, sampled by the hypervisor. It covers everything the instance does: queries, background work such as vacuum or purge, replication, and the operating system. It cannot tell you which of those is responsible, so treat it as the trigger and use Performance Insights or Enhanced Monitoring to find the cause.
Typical drivers in production, in rough order: a missing index or a new query plan causing full scans, a traffic increase, a batch or reporting job on the primary, connection storms (each new connection costs CPU, especially with TLS), and on PostgreSQL, autovacuum on large tables.
Recommended alarm settings
| Setting | Recommended value |
|---|---|
| Namespace | AWS/RDS |
| Metric | CPUUtilization |
| Dimensions | DBInstanceIdentifier |
| Statistic | Average |
| Threshold | 90.0 |
| Period | 60 seconds |
| Datapoints to alarm | 5 |
| Evaluation periods | 5 |
| Comparison operator | GreaterThanThreshold |
Tuning the alarm
- Burstable classes (db.t3, db.t4g): CPU above the baseline drains CPU credits. Alarm on
CPUCreditBalanceas well, and lower this threshold, because a t-class instance can be in trouble at 40% once credits are gone. - Known heavy jobs: if a nightly job pins CPU at 95% for twenty minutes by design, move it to a read replica rather than lengthening the window for everyone.
- Micro-bursts: if users complain about short slowdowns that a five-minute average misses, add a second alarm with fewer datapoints or the Maximum statistic, routed to a lower-urgency channel.
Check the alarm still makes sense after scaling. Moving to a larger instance class lowers CPU for the same work, so an alarm that fired weekly may go silent, while a downsize after a cost review can make it fire daily. Review CPU alarms whenever the instance class changes.
Create the alarm
aws cloudwatch put-metric-alarm \
  --alarm-name rds-orders-db-cpu-90 \
  --alarm-description "orders-db CPU above 90% for 5 minutes" \
  --namespace AWS/RDS \
  --metric-name CPUUtilization \
  --dimensions Name=DBInstanceIdentifier,Value=orders-db \
  --statistic Average \
  --period 60 \
  --evaluation-periods 5 \
  --datapoints-to-alarm 5 \
  --threshold 90 \
  --comparison-operator GreaterThanThreshold \
  --alarm-actions arn:aws:sns:eu-west-2:123456789012:oncall-alerts
When it fires
- Find the top SQL. Open Performance Insights for the instance, slice database load by SQL, and look at the statements consuming CPU. If Performance Insights is off, MySQL's
performance_schemaor PostgreSQL'spg_stat_statementsgives similar data. - Check what changed: a deploy, a new report, a sudden rise in
DatabaseConnections, or plan changes after statistics updates. - Relieve pressure: kill a runaway query if it is safe, pause a batch job, or point read traffic at a replica.
- Fix for good: add the missing index or rewrite the query; if the workload has simply outgrown the instance, scale the class with modify-db-instance (which involves a brief outage, or a failover for Multi-AZ).
Questions
How do I create a CloudWatch alarm for RDS CPU utilization?
Use put-metric-alarm on AWS/RDS CPUUtilization with the DBInstanceIdentifier dimension, Average over 60 seconds, GreaterThanThreshold 90 for 5 of 5 periods, or create it from the instance's Monitoring tab in the console.
Which CloudWatch alarms should I set for RDS?
A practical baseline is CPUUtilization, FreeStorageSpace, FreeableMemory, DatabaseConnections, ReadLatency and WriteLatency, plus ReplicaLag on replicas. Aurora clusters add metrics such as DBLoad and BufferCacheHitRatio.
Is 90% CPU on RDS always a problem?
Not if it is short. The alarm waits five minutes so that brief spikes from one heavy query do not page anyone; sustained 90% almost always means slower queries.
A database pinned at 90% CPU tends to show up first as slow pages and timeouts elsewhere. CloudConsole, a phone app for AWS, is built to show the RDS alarm and recent metrics on your phone so you can confirm the database is the cause.
Did it start after a deploy? What changed? on the app’s alarm screen lists the deploys and configuration changes from the hour before the alarm fired.
About the app → · Download on the App Store